The Climate of
Australia
 Tamarama beach in Sydney
Climate Map
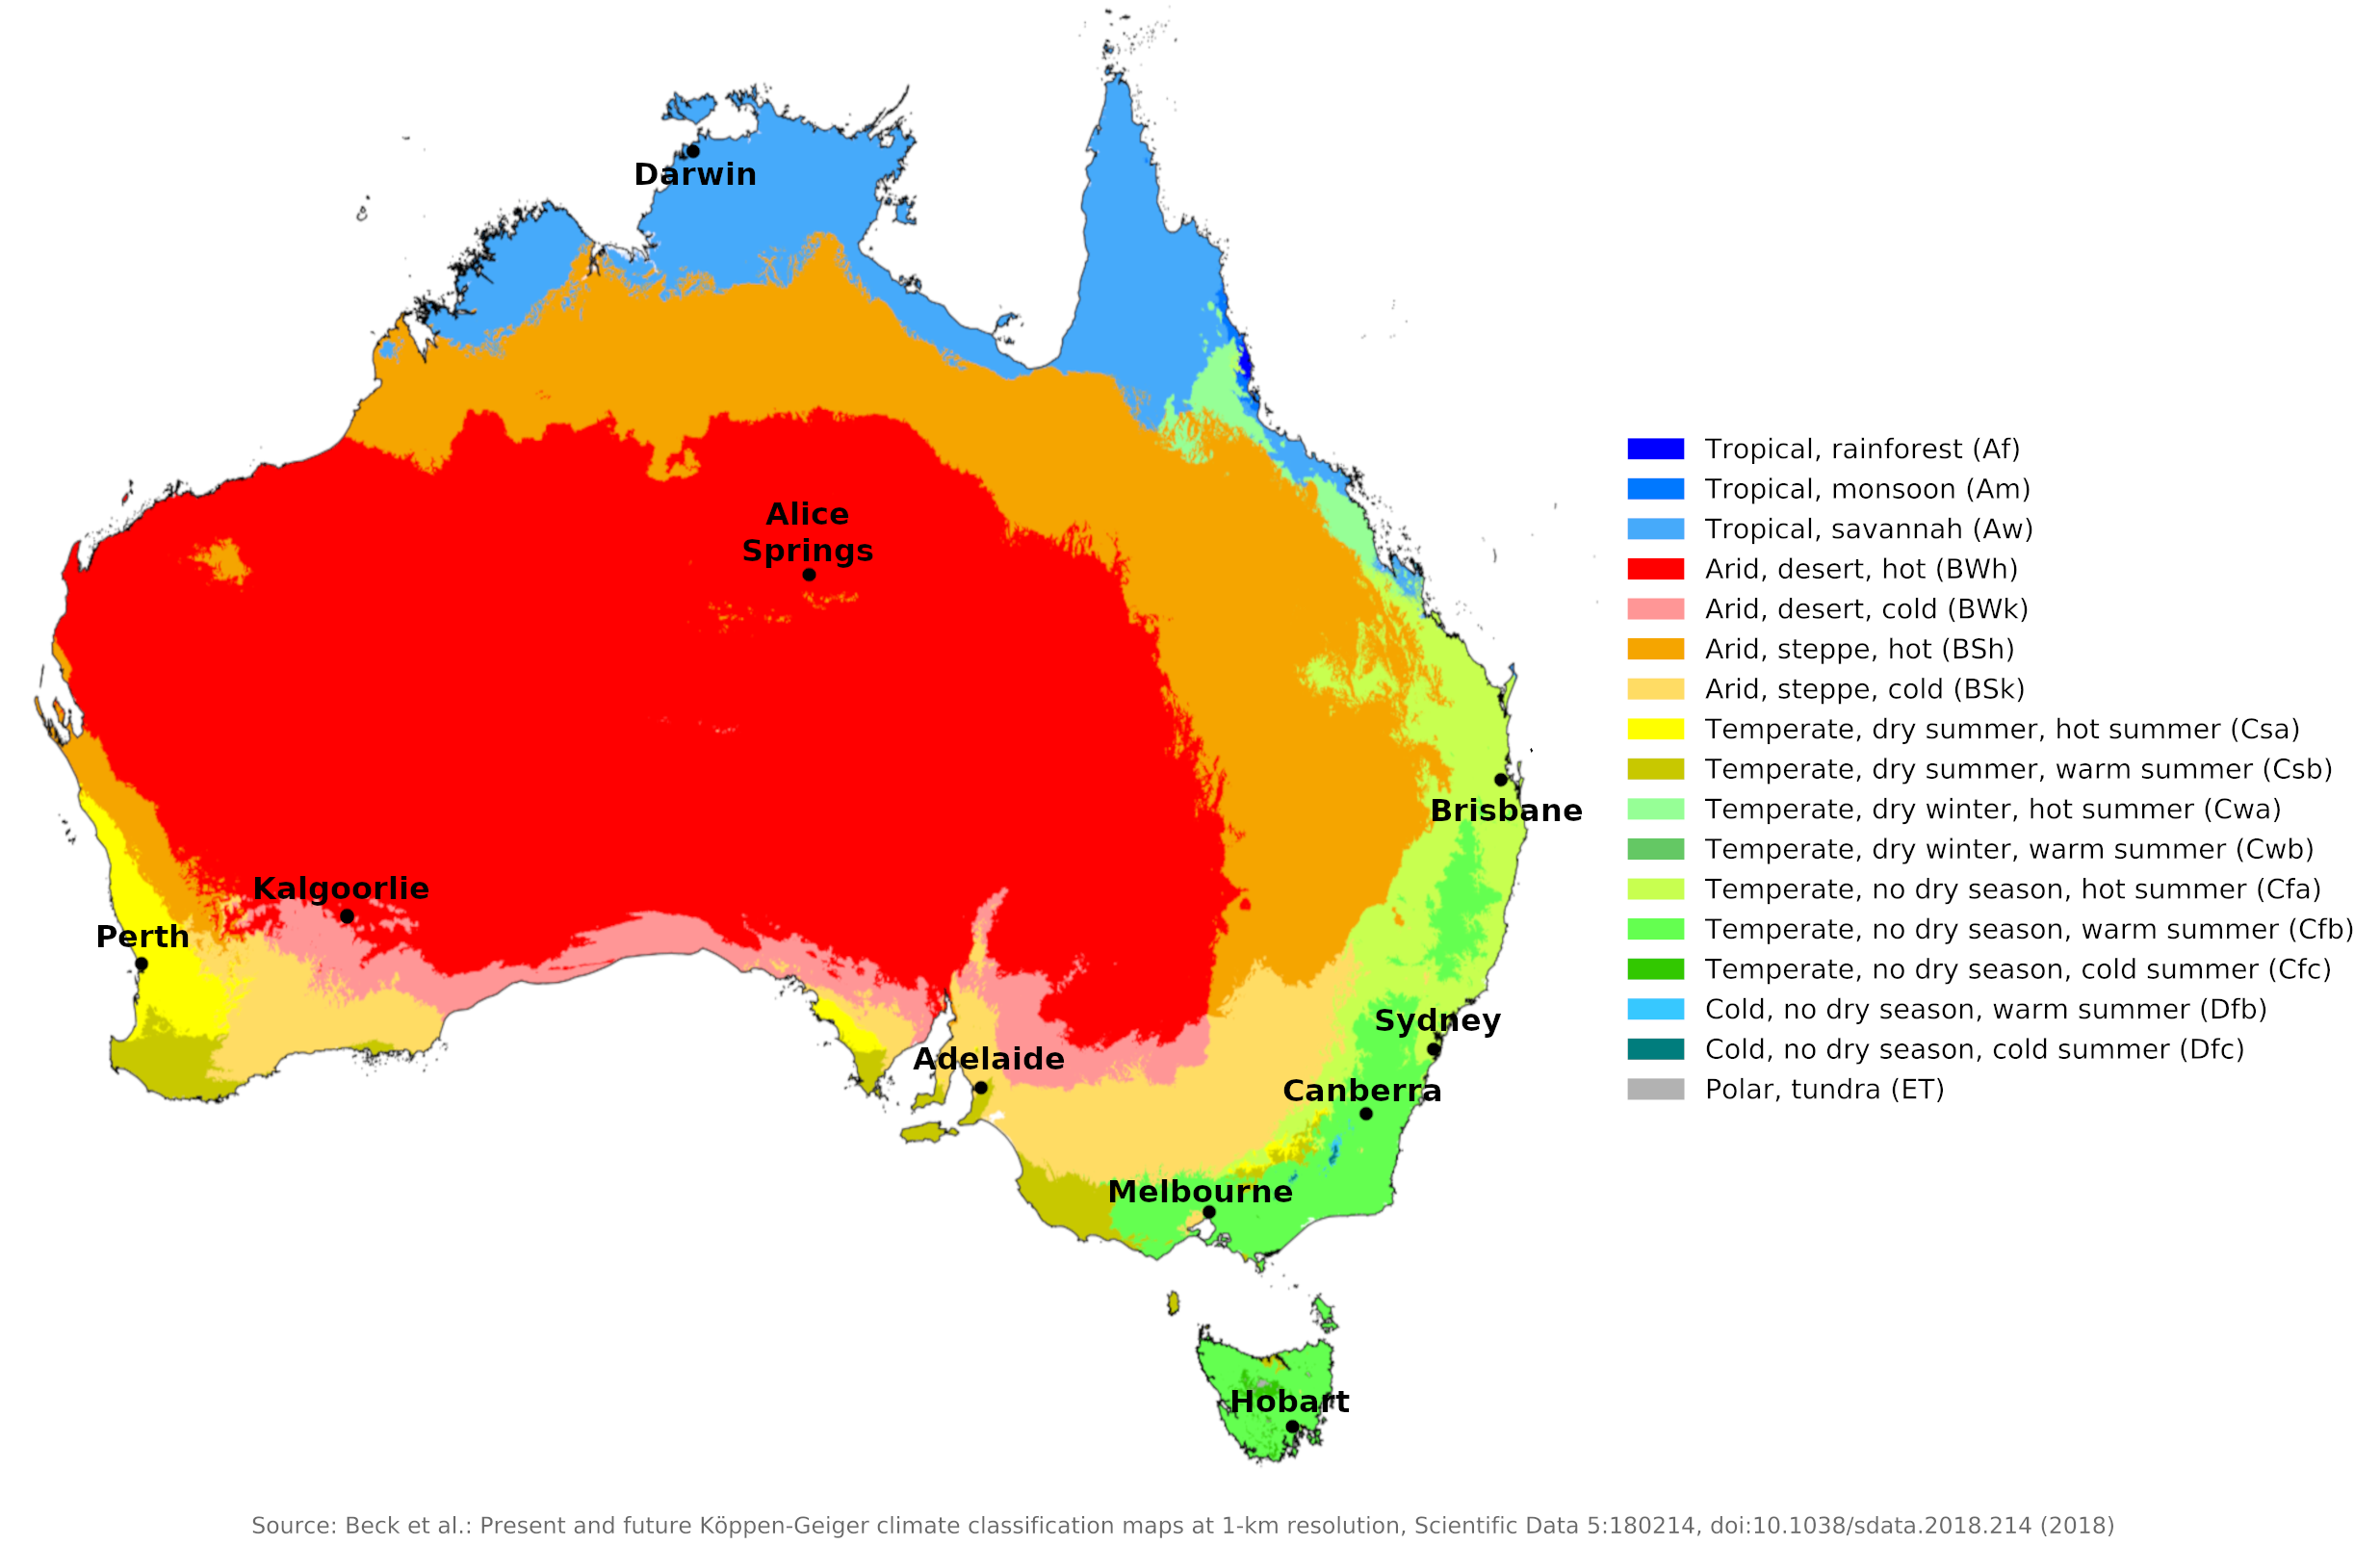 Climate map of Australia
What is the climate of Australia like?
Australia consists of a large island continent and the large offshore island of Tasmania. The country is only slightly smaller than the United States, but its small population is comparable to that of Canada. The majority of the Australian population lives in the climatically more favorable eastern, southern and south-western coastal areas. Between half and two-thirds of the country is desert or scrubland with low and unreliable rainfall, and this region is almost uninhabited. Almost half of Australia is in the tropics.
Most of Australia consists of flat or gently rolling plains ranging from 150 to 600 meters (500 to 2,000 feet) above sea level. The east coast is surrounded by an almost continuous range of hills or mountains, highest on the southern New South Wales/Victoria border. Here the Snowy Mountains encompass Australia's highest peak at 2,228 meters (7,310 feet). This is the only part of the country that gets significant snowfall, and even here the snow is not year-round. For much of the year, the east coast is exposed to the sustained and regular southeast trade winds that blow off the Pacific, and this is the wettest part of the country. West of these eastern highlands, rainfall decreases towards the interior, which is desert.
Central Australia lies in the latitude of the persistent subtropical anticyclonic belt and this is another reason for its drought. In this respect it resembles the Sahara and Kalahari deserts of Africa, although it is not quite as rainless as the Sahara.
Australia's wettest districts form a crescent shape around the country's 'dry heart'. The north-west coast in particular benefits from an annual monsoon from December to March, which penetrates up to 500 miles into the continent and sometimes sweeps across western and southern Queensland into northern interior New South Wales. These winds have become hot and humid as they cross the equatorial seas around Indonesia and the Philippines.
Australia's east and south-east coasts receive rain all year round, with a little more rain in the summer. The entire east coast of the continent is well irrigated. From Cape York almost to the Tropic of Capricorn, rainfall exceeds 1,250 millimeters (50 inches) and reaches to over 1,750 millimeters (70 inches). The south and south-west coasts of South and Western Australia are affected by western cyclones during the cooler winter season and experience their maximum rainfall at this time. The desert region reaches the coast between 18° and 30° S on the west coast and between 125° and 135° E on the south coast, so the country's wetter coastal fringe is not continuous.
Much of Australia is warm or hot year-round, and even on the cooler southern coasts, winters tend to be mild rather than cold. Only Tasmania, which is on the same latitude as New Zealand, has a temperate climate comparable to that of Britain or North West Europe. Very high temperatures can occasionally occur almost anywhere in Australia when winds blow from the interior and carry the high temperatures and low humidity of the interior desert to the coastal regions. Only Tasmania escapes such heat extremes; It also has copious amounts of rain throughout the year. The combination of prolonged heat waves and drought is one of the biggest climatic hazards in much of Australia and the main cause of the bushfires, which can rage for days.
Tropical cyclones, similar to the typhoons of the North Pacific and South China Seas, occur two or three times a year in the seas northeast and northwest of Australia. The northern part of the Queensland coast and the north and west coasts from Darwin to the south are affected by the torrential rains and sometimes very strong winds near the center of the storm. On Australia's north-west coast, these storms bear the Australian Aboriginal name "willy-willies".
Since much of the country is fairly low and flat, weather and climate contrasts are gradual and there are few sharp local changes. For a more detailed description the country can be divided into four climatic regions (in addition to Tasmania which is more temperate in climate): the tropical regional of the north and northeast, southeastern Australia, southern and western Australia, and the desert and semi-arid regions of central Australia. These climatic regions rarely coincide with state boundaries. Only Victoria and Tasmania, the two smallest states, do not include part of the dry interior.
The Tropical North and Northeast
Including the Great Barrier Reef, the northern extremities of Western Australia, Northern Territory (Darwin), Queensland (Brisbane).
This region consists of the coastal areas of Queensland, the Northern Territory and Western Australia and the inland districts, which receive more than 500 millimeters (20 inches) of precipitation annually. On the east coast, its southern limit is to the north of Brisbane, but as Brisbane shows, winter temperatures here are very close to what would normally be considered a tropical climate. Brisbane differs from places further north in that it has some rain in all months, in contrast to Darwin, which is more tropical, with a practical drought during the low sun period. This region is typically tropical with a combination of heat, precipitation and high humidity during the summer or high sunshine period from November to March. At this time the weather can be downright muggy and oppressive. Only sea breezes, when they occur, mitigate the excessive heat. The higher temperatures and lower humidity inland towards the dry interior are more bearable than the sweltering heat of the coast. Like most of Australia, this region has a very sunny climate, with daily sunshine hours averaging six to seven hours during the dry months. The annual hours of sunshine are similar to those in California or the European Mediterranean countries.
| Climate data for Darwin (1991–2020) | |||||||||||||
|---|---|---|---|---|---|---|---|---|---|---|---|---|---|
| Month | Jan | Feb | Mar | Apr | May | Jun | Jul | Aug | Sep | Oct | Nov | Dec | Year |
| Average high °C (°F) | 32.0 (89.6) | 31.7 (89.1) | 32.3 (90.1) | 33.0 (91.4) | 32.3 (90.1) | 31.1 (88.0) | 31.1 (88.0) | 31.9 (89.4) | 33.1 (91.6) | 33.8 (92.8) | 33.7 (92.7) | 33.0 (91.4) | 32.4 (90.4) |
| Daily mean °C (°F) | 28.5 (83.3) | 28.4 (83.1) | 28.6 (83.5) | 28.6 (83.5) | 27.3 (81.1) | 25.5 (77.9) | 25.2 (77.4) | 25.8 (78.4) | 28.0 (82.4) | 29.3 (84.7) | 29.5 (85.1) | 29.2 (84.6) | 27.8 (82.1) |
| Average low °C (°F) | 25.1 (77.2) | 25.1 (77.2) | 24.9 (76.8) | 24.2 (75.6) | 22.3 (72.1) | 20.0 (68.0) | 19.3 (66.7) | 19.8 (67.6) | 22.9 (73.2) | 24.8 (76.6) | 25.4 (77.7) | 25.5 (77.9) | 23.3 (73.9) |
| Average precipitation mm (inches) | 470.7 (18.53) | 412.4 (16.24) | 313.7 (12.35) | 105.1 (4.14) | 20.7 (0.81) | 2.1 (0.08) | 0.9 (0.04) | 0.8 (0.03) | 14.3 (0.56) | 68.9 (2.71) | 143.5 (5.65) | 279.3 (11.00) | 1,832.4 (72.14) |
| Source: Australian Bureau of Meteorology | |||||||||||||
| Climate data for Brisbane (1999–2020) | |||||||||||||
|---|---|---|---|---|---|---|---|---|---|---|---|---|---|
| Month | Jan | Feb | Mar | Apr | May | Jun | Jul | Aug | Sep | Oct | Nov | Dec | Year |
| Average high °C (°F) | 30.5 (86.9) | 30.2 (86.4) | 29.1 (84.4) | 27.1 (80.8) | 24.6 (76.3) | 22.0 (71.6) | 22.1 (71.8) | 23.4 (74.1) | 25.7 (78.3) | 27.0 (80.6) | 28.3 (82.9) | 29.6 (85.3) | 26.6 (79.9) |
| Daily mean °C (°F) | 26.1 (79.0) | 25.8 (78.4) | 24.7 (76.5) | 22.2 (72.0) | 19.2 (66.6) | 16.9 (62.4) | 16.2 (61.2) | 17.1 (62.8) | 19.7 (67.5) | 21.7 (71.1) | 23.5 (74.3) | 25.0 (77.0) | 20.7 (69.3) |
| Average low °C (°F) | 21.7 (71.1) | 21.4 (70.5) | 20.2 (68.4) | 17.4 (63.3) | 13.8 (56.8) | 11.9 (53.4) | 10.3 (50.5) | 10.8 (51.4) | 13.8 (56.8) | 16.4 (61.5) | 18.8 (65.8) | 20.4 (68.7) | 16.4 (61.5) |
| Average precipitation mm (inches) | 140 (5.5) | 150 (5.9) | 115 (4.5) | 61 (2.4) | 62 (2.4) | 67 (2.6) | 25 (1.0) | 36 (1.4) | 28 (1.1) | 78 (3.1) | 91 (3.6) | 129 (5.1) | 1,011 (39.8) |
| Source: Australian Bureau of Meteorology | |||||||||||||
Southeastern Australia
Including the southeastern corner of Queensland (Brisbane), Victoria (Melbourne), the greater part of New South Wales (Sydney, Canberra), but excluding the drier western and northwestern part of this state.
This part of Australia has attracted the most extensive settlement by Europeans since it was first settled near Sydney in the late 18th century. It has a climate that is best described as warm temperate with no real cold seasons, warm to hot summers, and rainfall well distributed throughout the year. The weather can be changeable at any time of the year and summers are prone to prolonged heat waves and droughts. The risk of drought is much greater inland as average rainfall decreases; persistent droughts and unreliable rainfall are ongoing issues in Australia's history.
Cold spells are brief and never severe on the coast, as shown by the charts for Sydney and Melbourne. Temperatures can drop much lower inland. Temperatures for Canberra also illustrate the effect of moderate elevation in lowering winter minimum temperatures. It should be noted that temperatures well above 100°F (38°C) are occasionally recorded in both Sydney and Melbourne.
In the south, the heat is generally less intense in summer and the cold is greater in winter. The latitude here is beginning to affect the number of hours of sunshine. Summer sun averages eight to nine hours a day in summer but only five to six in winter. In Melbourne, where the weather is cloudier despite less rainfall, the number of hours of sunshine per day in winter is only three to four compared to seven to eight in summer.
| Climate data for Sydney (1991–2020) | |||||||||||||
|---|---|---|---|---|---|---|---|---|---|---|---|---|---|
| Month | Jan | Feb | Mar | Apr | May | Jun | Jul | Aug | Sep | Oct | Nov | Dec | Year |
| Average high °C (°F) | 27.0 (80.6) | 26.8 (80.2) | 25.7 (78.3) | 23.6 (74.5) | 20.9 (69.6) | 18.3 (64.9) | 17.9 (64.2) | 19.3 (66.7) | 21.6 (70.9) | 23.2 (73.8) | 24.2 (75.6) | 25.7 (78.3) | 22.8 (73.0) |
| Daily mean °C (°F) | 23.5 (74.3) | 23.4 (74.1) | 22.1 (71.8) | 19.5 (67.1) | 16.6 (61.9) | 14.2 (57.6) | 13.4 (56.1) | 14.5 (58.1) | 17.0 (62.6) | 18.9 (66.0) | 20.4 (68.7) | 22.1 (71.8) | 18.8 (65.8) |
| Average low °C (°F) | 20.0 (68.0) | 19.9 (67.8) | 18.4 (65.1) | 15.3 (59.5) | 12.3 (54.1) | 10.0 (50.0) | 8.9 (48.0) | 9.7 (49.5) | 12.3 (54.1) | 14.6 (58.3) | 16.6 (61.9) | 18.4 (65.1) | 14.7 (58.5) |
| Average precipitation mm (inches) | 91.1 (3.59) | 131.5 (5.18) | 117.5 (4.63) | 114.1 (4.49) | 100.8 (3.97) | 142.0 (5.59) | 80.3 (3.16) | 75.1 (2.96) | 63.4 (2.50) | 67.7 (2.67) | 90.6 (3.57) | 73.0 (2.87) | 1,149.7 (45.26) |
| Source: Australian Bureau of Meteorology | |||||||||||||
| Climate data for Melbourne (1991–2020) | |||||||||||||
|---|---|---|---|---|---|---|---|---|---|---|---|---|---|
| Month | Jan | Feb | Mar | Apr | May | Jun | Jul | Aug | Sep | Oct | Nov | Dec | Year |
| Average high °C (°F) | 27.0 (80.6) | 26.9 (80.4) | 24.6 (76.3) | 21.1 (70.0) | 17.6 (63.7) | 15.1 (59.2) | 14.5 (58.1) | 15.9 (60.6) | 18.1 (64.6) | 20.5 (68.9) | 22.9 (73.2) | 24.8 (76.6) | 20.8 (69.4) |
| Daily mean °C (°F) | 21.6 (70.9) | 21.7 (71.1) | 19.6 (67.3) | 16.5 (61.7) | 13.7 (56.7) | 11.7 (53.1) | 11.0 (51.8) | 11.9 (53.4) | 13.8 (56.8) | 15.7 (60.3) | 17.9 (64.2) | 19.6 (67.3) | 16.2 (61.2) |
| Average low °C (°F) | 16.1 (61.0) | 16.4 (61.5) | 14.6 (58.3) | 11.8 (53.2) | 9.8 (49.6) | 8.2 (46.8) | 7.5 (45.5) | 7.9 (46.2) | 9.4 (48.9) | 10.9 (51.6) | 12.8 (55.0) | 14.3 (57.7) | 11.6 (52.9) |
| Average precipitation mm (inches) | 44.2 (1.74) | 50.2 (1.98) | 39.0 (1.54) | 53.2 (2.09) | 43.9 (1.73) | 49.5 (1.95) | 39.8 (1.57) | 47.0 (1.85) | 54.5 (2.15) | 55.8 (2.20) | 63.3 (2.49) | 60.9 (2.40) | 600.9 (23.66) |
| Source: Australian Bureau of Meteorology | |||||||||||||
| Climate data for Canberra (1991–2010) | |||||||||||||
|---|---|---|---|---|---|---|---|---|---|---|---|---|---|
| Month | Jan | Feb | Mar | Apr | May | Jun | Jul | Aug | Sep | Oct | Nov | Dec | Year |
| Average high °C (°F) | 28.8 (83.8) | 27.8 (82.0) | 24.9 (76.8) | 20.7 (69.3) | 16.6 (61.9) | 12.9 (55.2) | 12.1 (53.8) | 13.8 (56.8) | 16.8 (62.2) | 20.1 (68.2) | 23.4 (74.1) | 26.5 (79.7) | 20.4 (68.7) |
| Daily mean °C (°F) | 21.4 (70.5) | 20.8 (69.4) | 17.9 (64.2) | 13.7 (56.7) | 10.0 (50.0) | 7.3 (45.1) | 6.2 (43.2) | 7.5 (45.5) | 10.4 (50.7) | 13.4 (56.1) | 16.5 (61.7) | 19.3 (66.7) | 13.7 (56.7) |
| Average low °C (°F) | 14.0 (57.2) | 13.8 (56.8) | 10.9 (51.6) | 6.6 (43.9) | 3.4 (38.1) | 1.6 (34.9) | 0.3 (32.5) | 1.2 (34.2) | 4.0 (39.2) | 6.7 (44.1) | 9.6 (49.3) | 12.1 (53.8) | 7.0 (44.6) |
| Average precipitation mm (inches) | 61.3 (2.41) | 55.2 (2.17) | 37.6 (1.48) | 27.3 (1.07) | 31.5 (1.24) | 50.0 (1.97) | 44.3 (1.74) | 43.1 (1.70) | 55.8 (2.20) | 50.9 (2.00) | 68.4 (2.69) | 54.1 (2.13) | 579.5 (22.81) |
| Source: Australian Bureau of Meteorology | |||||||||||||
Southern and Southwestern Australia
Including the area around Spencer Gulf in South Australia (Adelaide), southwestern Western Australia (Perth), parts of western Victoria.
This region consists of two small districts separated by the desert coast along the Great Australian Bight where annual rainfall is under 250 millimeters (10 inches). These regions are characterized by a Mediterranean climate. Precipitation is moderate, falling mainly in winter. Summers are warm to hot with almost total drought. The winter season has much changeable weather associated with cyclonic disturbances in the westerly wind belt affecting southern Australia during this season. Light frosts occasionally occur on the flatlands of South Australia and ice can sometimes be seen on the highlands.
Perth and Adelaide are representative of the wetter parts of these two districts. The mildness of the winter is reflected in the fact that in both places the temperature has never dropped below freezing. The winter maximum of precipitation is very clearly marked in both places, but it rains much more heavily in Perth than in Adelaide. The extent of this wet winter climate is slightly greater in Western Australia than in South Australia, where the transition to inland desert is fairly rapid. In the summer, the sun is very powerful and the temperature reaches 38 °C (100 °F) in the shade while hot winds blow from the interior. In summer, these areas average between nine and ten hours of sunshine per day, compared to five to six in winter.
Western Australia basically has only two seasons, the winter or rainy season, which begins in April and ends in October, and the summer or dry season, which spans the rest of the year. During the rainy season there are frequent and heavy rains, and in summer there are thunderstorms with heavy showers, especially on the north-west coast, which is sometimes hit by hurricanes of great intensity. In the southern and early settled parts of the state, the average temperature is around 18°C (64°F), but in the more northern parts the heat is excessive, although the dryness of the atmosphere makes it preferable to the humid tropical climate.
| Climate data for Perth (1993–2020) | |||||||||||||
|---|---|---|---|---|---|---|---|---|---|---|---|---|---|
| Month | Jan | Feb | Mar | Apr | May | Jun | Jul | Aug | Sep | Oct | Nov | Dec | Year |
| Average high °C (°F) | 31.2 (88.2) | 31.5 (88.7) | 29.6 (85.3) | 26.0 (78.8) | 22.3 (72.1) | 19.5 (67.1) | 18.5 (65.3) | 19.1 (66.4) | 20.5 (68.9) | 23.4 (74.1) | 26.7 (80.1) | 29.4 (84.9) | 24.8 (76.6) |
| Daily mean °C (°F) | 24.7 (76.5) | 24.9 (76.8) | 23.2 (73.8) | 19.9 (67.8) | 16.4 (61.5) | 14.1 (57.4) | 13.2 (55.8) | 13.7 (56.7) | 15.1 (59.2) | 17.5 (63.5) | 20.5 (68.9) | 22.9 (73.2) | 18.8 (65.9) |
| Average low °C (°F) | 18.1 (64.6) | 18.3 (64.9) | 16.8 (62.2) | 13.8 (56.8) | 10.4 (50.7) | 8.6 (47.5) | 7.9 (46.2) | 8.3 (46.9) | 9.6 (49.3) | 11.6 (52.9) | 14.3 (57.7) | 16.4 (61.5) | 12.8 (55.0) |
| Average precipitation mm (inches) | 18.5 (0.73) | 14.3 (0.56) | 20.4 (0.80) | 35.4 (1.39) | 87.7 (3.45) | 127.3 (5.01) | 142.3 (5.60) | 124.4 (4.90) | 82.7 (3.26) | 37.7 (1.48) | 24.2 (0.95) | 10.4 (0.41) | 730.9 (28.78) |
| Source: Australian Bureau of Meteorology | |||||||||||||
| Climate data for Adelaide (1991–2020) | |||||||||||||
|---|---|---|---|---|---|---|---|---|---|---|---|---|---|
| Month | Jan | Feb | Mar | Apr | May | Jun | Jul | Aug | Sep | Oct | Nov | Dec | Year |
| Average high °C (°F) | 30.0 (86.0) | 29.7 (85.5) | 26.6 (79.9) | 23.0 (73.4) | 19.0 (66.2) | 16.2 (61.2) | 15.6 (60.1) | 16.7 (62.1) | 19.3 (66.7) | 22.5 (72.5) | 25.4 (77.7) | 27.6 (81.7) | 22.6 (72.7) |
| Daily mean °C (°F) | 23.8 (74.8) | 23.6 (74.5) | 21.0 (69.8) | 17.9 (64.2) | 14.6 (58.3) | 12.3 (54.1) | 11.7 (53.1) | 12.4 (54.3) | 14.6 (58.3) | 17.1 (62.8) | 19.8 (67.6) | 21.7 (71.1) | 17.5 (63.5) |
| Average low °C (°F) | 17.6 (63.7) | 17.5 (63.5) | 15.3 (59.5) | 12.7 (54.9) | 10.2 (50.4) | 8.3 (46.9) | 7.7 (45.9) | 8.1 (46.6) | 9.9 (49.8) | 11.7 (53.1) | 14.1 (57.4) | 15.8 (60.4) | 12.4 (54.3) |
| Average precipitation mm (inches) | 21.2 (0.83) | 20.0 (0.79) | 24.9 (0.98) | 37.6 (1.48) | 59.3 (2.33) | 77.7 (3.06) | 71.1 (2.80) | 66.9 (2.63) | 59.6 (2.35) | 40.0 (1.57) | 31.0 (1.22) | 28.3 (1.11) | 536.5 (21.12) |
| Source: Australian Bureau of Meteorology | |||||||||||||
The Interior and Semi-desert
Including (with towns and cities in parentheses) the inland part of Northern Territory (Alice Springs), the greater part of Western Australia (Kalgoorlie), South Australia.
This is Australia's most extensive climatic region and includes parts of all mainland states except Victoria. In the north it can be roughly defined by the 500 millimeter (20 inches) annual precipitation limit and in the south by the 300 millimeter (12 inches) annual precipitation limit. Rainfall is sparse and unreliable everywhere. The cool season rainfall in the south is usually higher than in Australia's tropical north. Compare Alice Springs, which lies almost in the middle of the continent, and Kalgoorlie, which lies on the desert edge of Western Australia.
Like most continental interiors, there are significant daily and seasonal temperature variations. Both Alice Springs and Kalgoorlie have experienced sub-freezing temperatures and in Alice Springs, which is almost in the tropics, they have fallen below freezing in several winter months. These desert areas are the sunniest part of Australia. Daily hours of sunshine average nine to ten a year. The high temperatures are partially mitigated by low humidity. Occasional dust storms with high winds are a minor climatic hazard.
| Climate data for Alice Springs (1991-2020) | |||||||||||||
|---|---|---|---|---|---|---|---|---|---|---|---|---|---|
| Month | Jan | Feb | Mar | Apr | May | Jun | Jul | Aug | Sep | Oct | Nov | Dec | Year |
| Average high °C (°F) | 37.1 (98.8) | 35.8 (96.4) | 33.5 (92.3) | 29.3 (84.7) | 23.6 (74.5) | 20.1 (68.2) | 20.7 (69.3) | 23.5 (74.3) | 28.8 (83.8) | 31.9 (89.4) | 34.4 (93.9) | 35.7 (96.3) | 29.5 (85.2) |
| Daily mean °C (°F) | 29.7 (85.5) | 28.5 (83.3) | 25.7 (78.3) | 21.1 (70.0) | 15.8 (60.4) | 12.4 (54.3) | 12.3 (54.1) | 14.7 (58.5) | 20.0 (68.0) | 23.4 (74.1) | 26.4 (79.5) | 28.2 (82.8) | 21.5 (70.7) |
| Average low °C (°F) | 22.3 (72.1) | 21.1 (70.0) | 17.9 (64.2) | 12.9 (55.2) | 8.0 (46.4) | 4.7 (40.5) | 3.9 (39.0) | 5.8 (42.4) | 11.2 (52.2) | 14.9 (58.8) | 18.3 (64.9) | 20.7 (69.3) | 13.5 (56.2) |
| Average precipitation mm (inches) | 48.9 (1.93) | 40.7 (1.60) | 19.9 (0.78) | 19.9 (0.78) | 17.5 (0.69) | 10.3 (0.41) | 13.0 (0.51) | 3.8 (0.15) | 7.8 (0.31) | 18.7 (0.74) | 33.0 (1.30) | 41.3 (1.63) | 274.8 (10.83) |
| Source: Australian Bureau of Meteorology | |||||||||||||
| Climate data for Kalgoorlie | |||||||||||||
|---|---|---|---|---|---|---|---|---|---|---|---|---|---|
| Month | Jan | Feb | Mar | Apr | May | Jun | Jul | Aug | Sep | Oct | Nov | Dec | Year |
| Average high °C (°F) | 33.6 (92.5) | 32.1 (89.8) | 29.5 (85.1) | 25.3 (77.5) | 20.6 (69.1) | 17.5 (63.5) | 16.7 (62.1) | 18.6 (65.5) | 22.3 (72.1) | 25.8 (78.4) | 28.9 (84.0) | 31.9 (89.4) | 25.2 (77.4) |
| Daily mean °C (°F) | 25.9 (78.6) | 25.0 (77.0) | 22.8 (73.0) | 19.1 (66.4) | 14.7 (58.5) | 11.9 (53.4) | 10.9 (51.6) | 12.1 (53.8) | 15.2 (59.4) | 18.4 (65.1) | 21.5 (70.7) | 24.2 (75.6) | 18.5 (65.3) |
| Average low °C (°F) | 18.2 (64.8) | 17.8 (64.0) | 16.0 (60.8) | 12.8 (55.0) | 8.7 (47.7) | 6.2 (43.2) | 5.0 (41.0) | 5.5 (41.9) | 8.0 (46.4) | 11.0 (51.8) | 14.0 (57.2) | 16.5 (61.7) | 11.6 (52.9) |
| Average precipitation mm (inches) | 23.6 (0.93) | 31.2 (1.23) | 24.0 (0.94) | 20.0 (0.79) | 26.5 (1.04) | 28.9 (1.14) | 24.9 (0.98) | 21.4 (0.84) | 14.0 (0.55) | 14.8 (0.58) | 17.8 (0.70) | 16.4 (0.65) | 264.8 (10.43) |
| Source: Australian Bureau of Meteorology | |||||||||||||
Tasmania
Slightly smaller than Scotland, this rugged island is mountainous, so there are quite large differences in weather and climate between the coastal regions and the interior. The highest mountains rise to over 1,500 meters (5,000 feet) and in the west are fully exposed to blustery westerly winds that bring heavy rainfall: in places over 2,500 millimeters (100 inches) per year. The eastern lowlands, shown by the climate for Hobart, has much less rainfall, at 500 to 750 millimeters (20 to 30 inches) per year. The weather is changeable and often disturbed all year round.
Tasmania's climate is heavily influenced by the relative warmth of the Southern Ocean, so winters are mild at sea level and summers are rarely very hot. Year-round climate and weather are similar to those of north-western Europe, particularly Brittany or north-western Spain. Daily hours of sunshine range from four to five in winter to seven or eight in summer, sunnier than much of north-west Europe. The occasional high summer temperatures (over 100°F or 38°C) occur when very warm air is drawn south from Australia's central region. Although there is often a lot of snow on the mountains in winter, it doesn't stay there all summer.
| Climate data for Hobart (1991–2020) | |||||||||||||
|---|---|---|---|---|---|---|---|---|---|---|---|---|---|
| Month | Jan | Feb | Mar | Apr | May | Jun | Jul | Aug | Sep | Oct | Nov | Dec | Year |
| Average high °C (°F) | 22.6 (72.7) | 22.5 (72.5) | 20.7 (69.3) | 18.1 (64.6) | 15.6 (60.1) | 13.0 (55.4) | 12.7 (54.9) | 13.8 (56.8) | 15.5 (59.9) | 17.4 (63.3) | 19.5 (67.1) | 20.8 (69.4) | 17.7 (63.9) |
| Daily mean °C (°F) | 17.4 (63.3) | 17.4 (63.3) | 15.8 (60.4) | 13.5 (56.3) | 11.3 (52.3) | 8.9 (48.0) | 8.5 (47.3) | 9.4 (48.9) | 10.9 (51.6) | 12.6 (54.7) | 14.5 (58.1) | 15.9 (60.6) | 13.0 (55.4) |
| Average low °C (°F) | 12.2 (54.0) | 12.2 (54.0) | 10.9 (51.6) | 8.8 (47.8) | 6.9 (44.4) | 4.7 (40.5) | 4.2 (39.6) | 5.0 (41.0) | 6.3 (43.3) | 7.8 (46.0) | 9.5 (49.1) | 10.9 (51.6) | 8.3 (46.9) |
| Average precipitation mm (inches) | 41.1 (1.62) | 32.5 (1.28) | 36.2 (1.43) | 37.4 (1.47) | 27.3 (1.07) | 35.1 (1.38) | 36.5 (1.44) | 46.2 (1.82) | 44.0 (1.73) | 43.2 (1.70) | 39.1 (1.54) | 51.0 (2.01) | 469.6 (18.49) |
| Source: Australian Bureau of Meteorology | |||||||||||||
References
- E. A. Pearce, Charles Gordon Smith, (1990) The Hutchinson World Weather Guide, John Murray Press. ISBN 1859863426
- Timothy L. Gall, (ed.), (2003), Worldmark Encyclopedia of the Nations, Eleventh Edition, Thomson Gale
- Hugh Chisholm, (ed.), (1911), Encyclopædia Britannica, Eleventh edition, Cambridge University Press
The Climate of
Australia
In summary:
Although it has a wide diversity of climatic conditions, Australia is generally warm and dry, with no extreme cold and little frost, its temperatures ranging from comfortably mild in the south to hot in the central interior and north. Summer readings often reach 38°C (100°F) or more in almost any area of the continent and may exceed 46°C (115°F) in interior regions. Winds are light to moderate, except along the coasts, where cyclones have occurred.
The continent is subject to great variations in rainfall, but except for a few areas rainfall is insufficient, and the rate of evaporation is high. Mean annual rainfall is 420 mm (17 in), much less than the world mean of 660 mm (26 in). About 18% of the land area is desert. Only about 20% has more than 760 mm (30 in) of rain annually, but these areas suffer from a long dry season, while others have too much rain. Only Tasmania, Victoria, and parts of New South Wales have enough rainfall all year round. Droughts and floods occur irregularly but frequently over large areas.