The Climate of
Canada
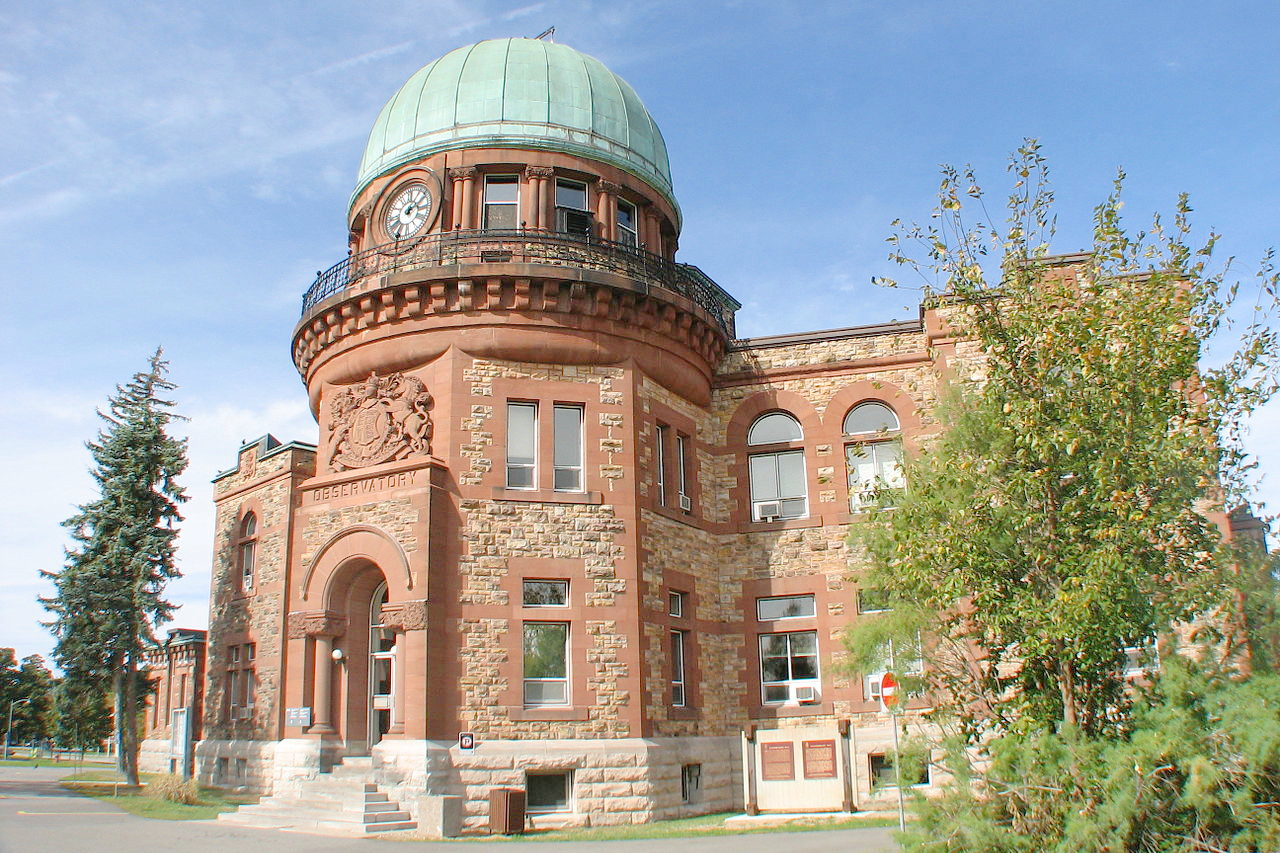 Dominion Observatory, Ottawa
Climate Map
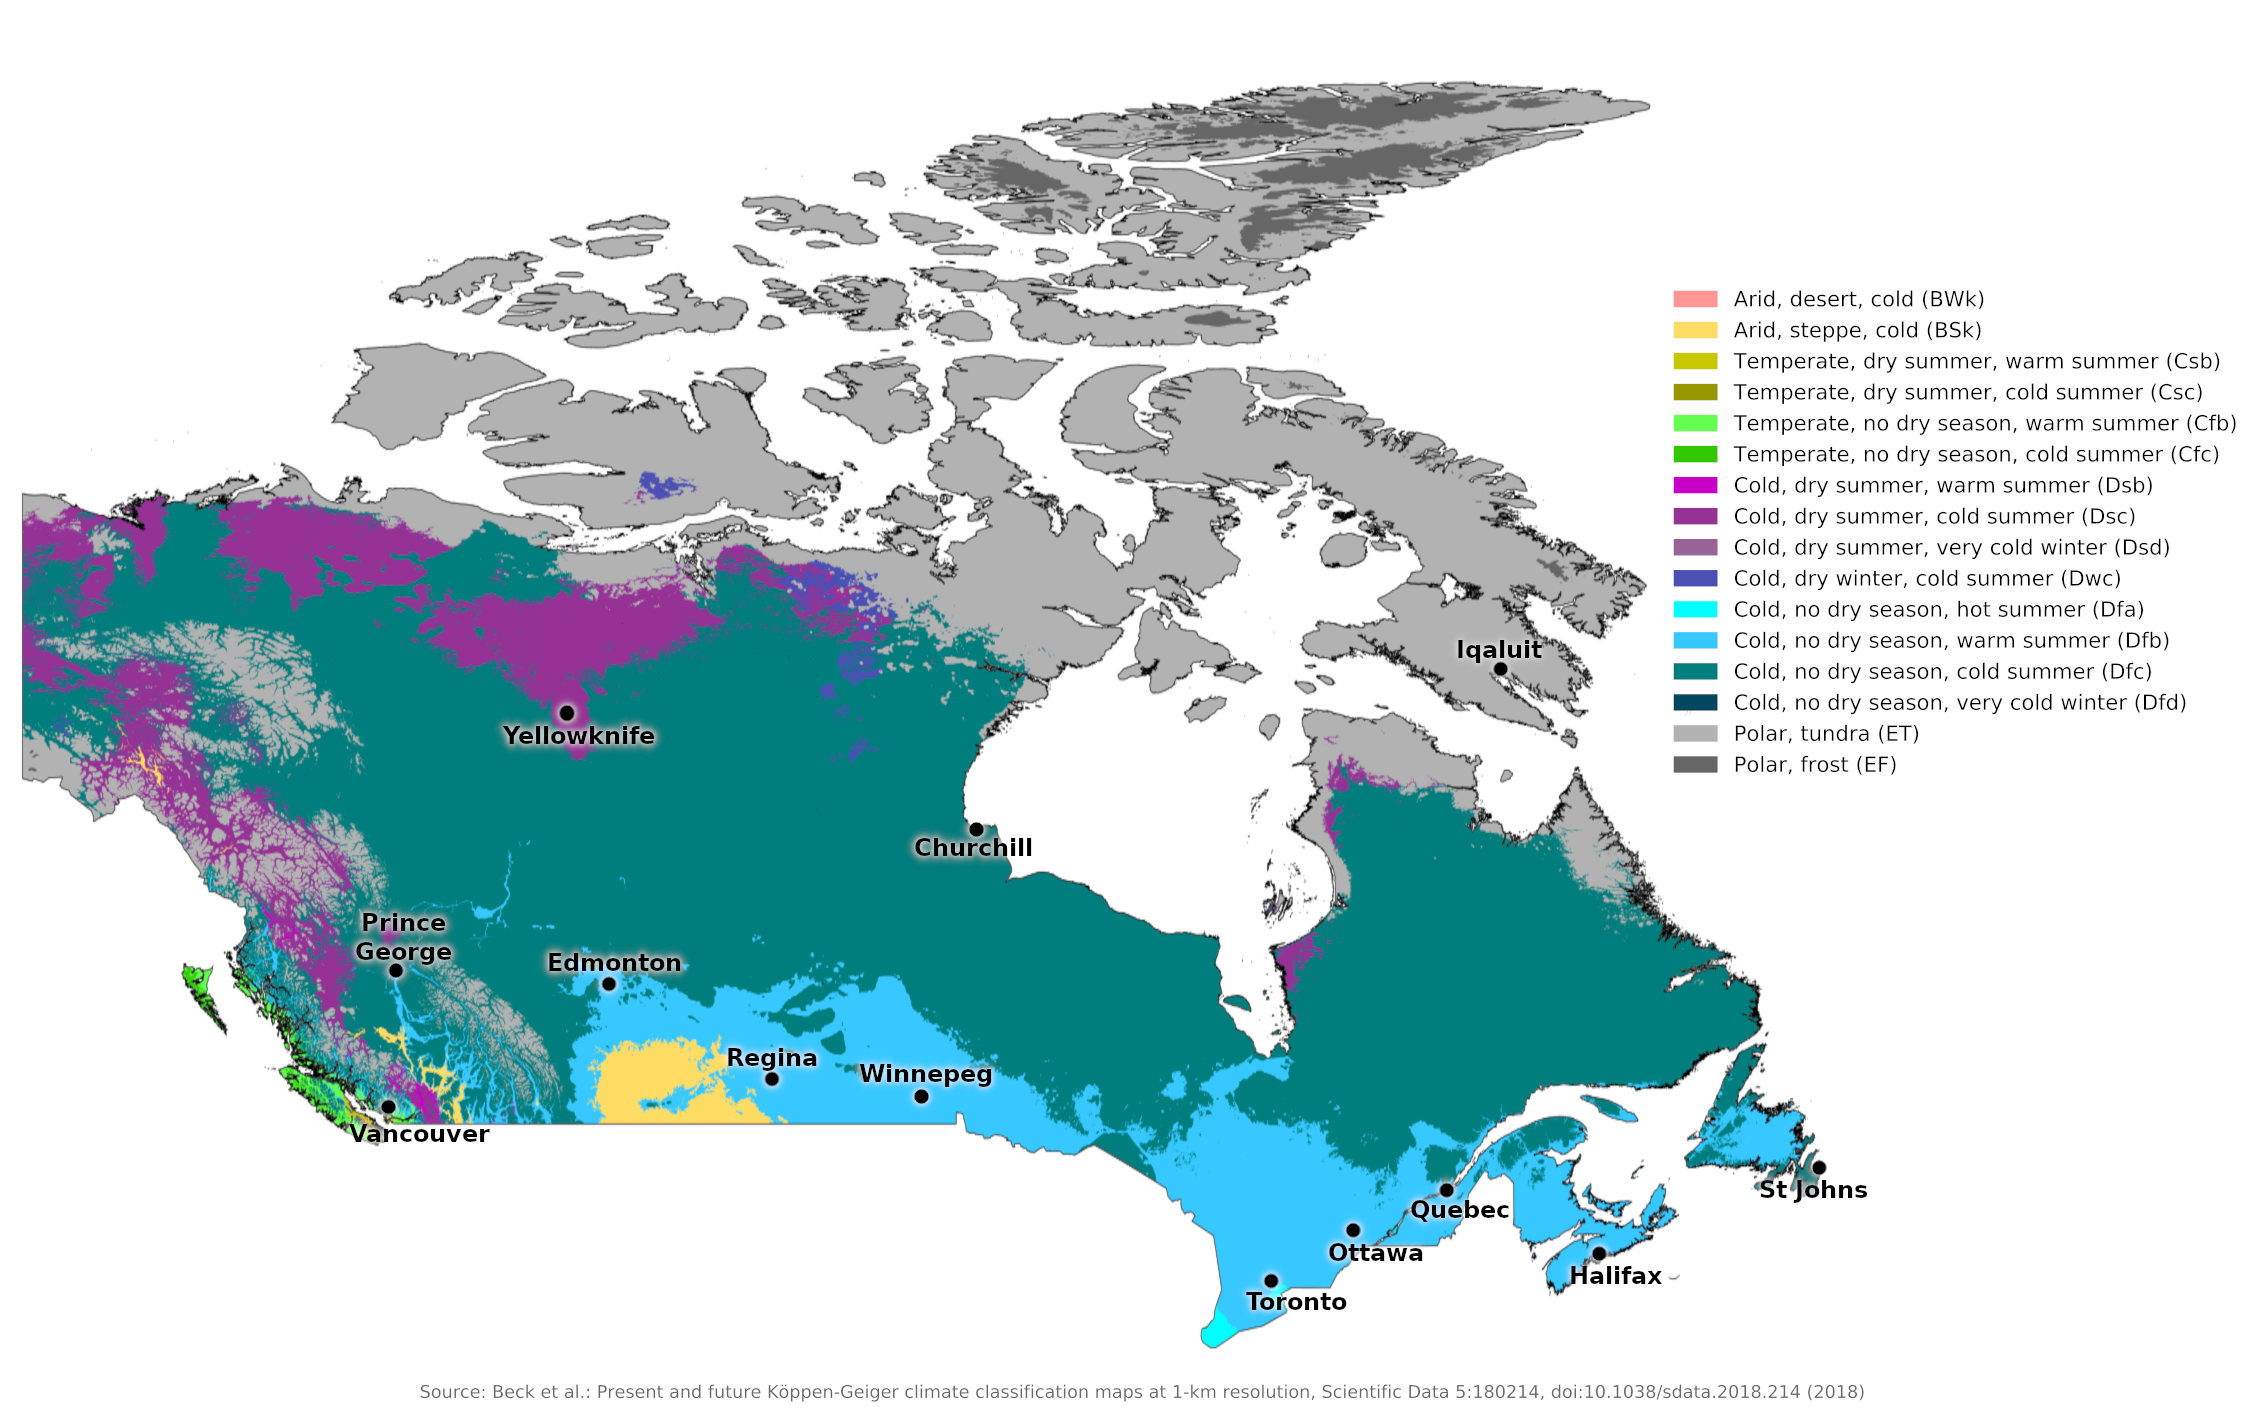 Climate map of Canada
What is the climate of Canada like?
Canada is a vast country lying between 42°N and the high Arctic, touching three oceans. There are large climate fluctuations. Much of Canada lies within the Arctic Circle, and only a narrow strip near the southern border with the United States has a temperate climate. Much of this favored area has severe winters with persistent frost and snow. With the exception of Hudson Bay, which is frozen about nine months of the year, Canada's northern coast on the Arctic Ocean is permanently iced over or heavily blocked by ice floes for most of the year. Only the Pacific coast of British Columbia and the Atlantic coast of Newfoundland and the coastal provinces south of the Gulf of St. Lawrence have ports that do not regularly freeze over in winter.
The reasons for the very cold winters in most parts of Canada are the northern latitude of much of the country and the generally flat and low-lying land east of the Rocky Mountains. Cold air from the Canadian Arctic has virtually no obstacle as it flows south and east during winter and spring, bringing very cold conditions to most of the country. Southern Canada also lies in one of the most visited areas of cyclonic depressions in North America; Many of them pass through the Great Lakes region and the Saint Lawrence Valley before heading to the Atlantic. The cold air involved in the circulation of these sinks often originates far to the north.
The influence of warmer Pacific-origin ocean air is mainly limited to the small area of Canada west of the Rocky Mountains in British Columbia. The coast and some inland valleys in this province have a very different climate to the rest of the country, resembling that of the British Isles and other parts of North West Europe. Here winters are mild and summers warm, with rain all year round but with a maximum in winter.
Winter temperatures on Canada's Atlantic coasts are slightly warmer than in the interior of the continent, particularly where the sea does not freeze, but summer temperatures are kept lower than in the interior of the continent due to the cold Labrador Current flowing south near the coast.
Much of inland Canada has a very continental climate with surprisingly high summer temperatures despite the shortness of summer and a long, very cold winter. Even the barren Northlands of Canada have fairly warm summers.
For a more detailed description of Canada's climate, it is convenient to divide the country into the following climate regions: eastern Canada, the St Lawrence and Great Lakes region, the Prairies, western Canada including the Rockies, and northern Canada.
Eastern Canada
Including Newfoundland, the coast of Labrador, Nova Scotia, New Brunswick, Prince Edward Island.
Labrador is very cold and inhospitable, largely due to the iceberg-laden currents sweeping down the coast from the Labrador Sea, bringing fog and long snowy winters and temperatures below freezing for much of the year. South of the Gulf of St. Lawrence, however, the coastal provinces have much more comfortable temperatures averaging 5°C (40°F) for the year and over 15°C (60°F) for the summer months. This region includes those areas where the influence of the Atlantic Ocean modifies the harshness of winters somewhat and makes summers somewhat cooler and more changeable than further inland. Frequent weather changes from day to day are the norm in all months, clouds and rain occur throughout the year. Much of the winter precipitation falls in the form of snow, which can lie for long periods except on the coast. The climate for St. John's and Halifax shows the influence of the open sea by keeping winter temperatures slightly higher and summer temperatures slightly lower than locations further inland.
Sea fog is common in this area and can persist offshore during the summer months. The Grand Banks area south of Newfoundland and the Gulf of St. Lawrence have some of the foggiest sea areas in the world. Another danger in this sea area is the frequent appearance of icebergs in summer; They are drifting south in the cold waters of the Labrador Current. The temperature difference between the warm waters of the Gulf Stream and the cold Labrador Current is the main cause of the fogs. This is one of Canada's least sunny regions. Hours of sunshine per day range from two or three in winter to seven or eight in summer.
| Climate data for St. John's, Newfoundland (1981–2010) | |||||||||||||
|---|---|---|---|---|---|---|---|---|---|---|---|---|---|
| Month | Jan | Feb | Mar | Apr | May | Jun | Jul | Aug | Sep | Oct | Nov | Dec | Year |
| Average high °C (°F) | −0.8 (30.6) | −1.1 (30.0) | 1.0 (33.8) | 5.6 (42.1) | 11.1 (52.0) | 15.8 (60.4) | 20.7 (69.3) | 20.5 (68.9) | 16.5 (61.7) | 10.8 (51.4) | 6.4 (43.5) | 1.8 (35.2) | 9.0 (48.2) |
| Daily mean °C (°F) | −4.5 (23.9) | −4.9 (23.2) | −2.6 (27.3) | 1.9 (35.4) | 6.4 (43.5) | 10.9 (51.6) | 15.8 (60.4) | 16.1 (61.0) | 12.4 (54.3) | 7.4 (45.3) | 3.0 (37.4) | −1.5 (29.3) | 5.0 (41.0) |
| Average low °C (°F) | −8.2 (17.2) | −8.6 (16.5) | −6.1 (21.0) | −1.9 (28.6) | 1.7 (35.1) | 5.9 (42.6) | 10.9 (51.6) | 11.6 (52.9) | 8.2 (46.8) | 3.9 (39.0) | −0.3 (31.5) | −4.7 (23.5) | 1.0 (33.8) |
| Average precipitation mm (inches) | 149.2 (5.87) | 129.5 (5.10) | 142.2 (5.60) | 122.9 (4.84) | 102.6 (4.04) | 97.6 (3.84) | 91.6 (3.61) | 100.0 (3.94) | 129.6 (5.10) | 156.2 (6.15) | 148.1 (5.83) | 164.8 (6.49) | 1,534.2 (60.40) |
| Average snowfall cm (inches) | 88.7 (34.9) | 71.0 (28.0) | 57.3 (22.6) | 25.3 (10.0) | 4.4 (1.7) | 0.0 (0.0) | 0.0 (0.0) | 0.0 (0.0) | 0.0 (0.0) | 2.4 (0.9) | 22.4 (8.8) | 63.4 (25.0) | 335.0 (131.9) |
| Source: Environment and Climate Change Canada | |||||||||||||
| Climate data for Halifax, Nova Scotia (1981–2010) | |||||||||||||
|---|---|---|---|---|---|---|---|---|---|---|---|---|---|
| Month | Jan | Feb | Mar | Apr | May | Jun | Jul | Aug | Sep | Oct | Nov | Dec | Year |
| Average high °C (°F) | −0.1 (31.8) | 0.4 (32.7) | 3.6 (38.5) | 8.7 (47.7) | 14.4 (57.9) | 19.6 (67.3) | 23.1 (73.6) | 23.1 (73.6) | 19.3 (66.7) | 13.4 (56.1) | 8.1 (46.6) | 2.8 (37.0) | 11.4 (52.5) |
| Daily mean °C (°F) | −4.1 (24.6) | −3.6 (25.5) | −0.2 (31.6) | 4.9 (40.8) | 10.1 (50.2) | 15.2 (59.4) | 18.8 (65.8) | 19.1 (66.4) | 15.5 (59.9) | 9.9 (49.8) | 4.8 (40.6) | −0.8 (30.6) | 7.5 (45.5) |
| Average low °C (°F) | −8.2 (17.2) | −7.5 (18.5) | −3.9 (25.0) | 1.0 (33.8) | 5.8 (42.4) | 10.7 (51.3) | 14.4 (57.9) | 15.1 (59.2) | 11.8 (53.2) | 6.4 (43.5) | 1.5 (34.7) | −4.3 (24.3) | 3.6 (38.5) |
| Average precipitation mm (inches) | 139.7 (5.50) | 110.1 (4.33) | 132.5 (5.22) | 118.3 (4.66) | 119.1 (4.69) | 111.8 (4.40) | 110.3 (4.34) | 96.4 (3.80) | 108.9 (4.29) | 124.3 (4.89) | 151.4 (5.96) | 145.1 (5.71) | 1,468.1 (57.80) |
| Average snowfall cm (inches) | 43.1 (17.0) | 35.0 (13.8) | 31.2 (12.3) | 7.0 (2.8) | 0.8 (0.3) | 0.0 (0.0) | 0.0 (0.0) | 0.0 (0.0) | 0.0 (0.0) | 0.1 (0.0) | 7.8 (3.1) | 29.2 (11.5) | 154.2 (60.7) |
| Source: Environment and Climate Change Canada | |||||||||||||
The St Lawrence and Great Lakes Region
Including southern and central parts of Québec, southern and central parts of Ontario.
This region borders the Great Lakes and the United States to the south and is the southernmost part of Canada. It is the most densely populated and developed part of the country. The southern latitude and the warmth of the waters of the lakes, which do not normally freeze completely until December, help make this one of the warmest parts of Canada.
However, as shown by the climate for Ottawa, Québec and Toronto, the winters are severe here. Toronto, on the shores of Lake Ontario, has warmer winter temperatures than Ottawa and Quebec. Winters are brilliant but cold, and summers average between 15 and 20°C (60 to 68°F), with generally clear skies and an invigorating atmosphere that make these regions popular summer vacation spots. Summers are fairly warm with significant hours of sunshine, averaging eight to nine hours a day.
In Quebec and northern Ontario, rainfall decreases, ranging from 500 to 1,000 millimeters (20 to 40 inches), while snow is deep in winter, generally covering the ground from mid-December to mid-March. This is one of the snowiest regions in North America, excluding parts of the western Rocky Mountains. In an average winter, 2.5 to 3 meters (8 to 10 feet) of snow may fall, but it does not necessarily accumulate to this depth due to periodic thawing and evaporation.
Winter storms often sweep just north of southern Ontario, so what falls as snow in the north is rain in the south, resulting in a much more variable winter, often with too little snow for sledding. Summers are warm, with an average temperature of 20°C (68°F) and occasionally rising above 30°C (86°F). As in eastern Canada, the weather here can be very variable at any time of the year, with some years experiencing early or late cold snaps and mid-winter thaws. This weather variability and the relatively high annual precipitation are a result of the region's location in the wake of numerous storms.
| Climate data for Ottawa (1981–2010) | |||||||||||||
|---|---|---|---|---|---|---|---|---|---|---|---|---|---|
| Month | Jan | Feb | Mar | Apr | May | Jun | Jul | Aug | Sep | Oct | Nov | Dec | Year |
| Average high °C (°F) | −5.8 (21.6) | −3.1 (26.4) | 2.4 (36.3) | 11.4 (52.5) | 19.0 (66.2) | 24.1 (75.4) | 26.6 (79.9) | 25.4 (77.7) | 20.5 (68.9) | 12.8 (55.0) | 5.5 (41.9) | −2.0 (28.4) | 11.4 (52.5) |
| Daily mean °C (°F) | −10.2 (13.6) | −7.9 (17.8) | −2.2 (28.0) | 6.5 (43.7) | 13.5 (56.3) | 18.7 (65.7) | 21.2 (70.2) | 19.9 (67.8) | 15.3 (59.5) | 8.4 (47.1) | 2.0 (35.6) | −5.6 (21.9) | 6.6 (43.9) |
| Average low °C (°F) | −14.4 (6.1) | −12.5 (9.5) | −6.8 (19.8) | 1.5 (34.7) | 8.0 (46.4) | 13.3 (55.9) | 15.7 (60.3) | 14.5 (58.1) | 10.1 (50.2) | 4.0 (39.2) | −1.5 (29.3) | −9.2 (15.4) | 1.9 (35.4) |
| Average precipitation mm (inches) | 62.9 (2.48) | 49.7 (1.96) | 57.5 (2.26) | 71.1 (2.80) | 86.6 (3.41) | 92.7 (3.65) | 84.4 (3.32) | 83.8 (3.30) | 92.7 (3.65) | 85.9 (3.38) | 82.7 (3.26) | 69.5 (2.74) | 919.5 (36.20) |
| Average snowfall cm (inches) | 44.3 (17.4) | 34.7 (13.7) | 29.1 (11.5) | 7.2 (2.8) | 0.0 (0.0) | 0.0 (0.0) | 0.0 (0.0) | 0.0 (0.0) | 0.0 (0.0) | 2.9 (1.1) | 16.0 (6.3) | 41.3 (16.3) | 175.4 (69.1) |
| Source: Environment and Climate Change Canada | |||||||||||||
| Climate data for Quebec City (1981–2010) | |||||||||||||
|---|---|---|---|---|---|---|---|---|---|---|---|---|---|
| Month | Jan | Feb | Mar | Apr | May | Jun | Jul | Aug | Sep | Oct | Nov | Dec | Year |
| Average high °C (°F) | −7.9 (17.8) | −5.6 (21.9) | 0.2 (32.4) | 8.3 (46.9) | 17.0 (62.6) | 22.3 (72.1) | 25.0 (77.0) | 23.6 (74.5) | 17.9 (64.2) | 11.1 (52.0) | 2.9 (37.2) | −4.2 (24.4) | 9.2 (48.6) |
| Daily mean °C (°F) | −12.8 (9.0) | −10.6 (12.9) | −4.6 (23.7) | 3.7 (38.7) | 11.2 (52.2) | 16.4 (61.5) | 19.3 (66.7) | 18.1 (64.6) | 12.7 (54.9) | 6.6 (43.9) | −0.7 (30.7) | −8.6 (16.5) | 4.2 (39.6) |
| Average low °C (°F) | −17.7 (0.1) | −15.6 (3.9) | −9.4 (15.1) | −1 (30) | 5.4 (41.7) | 10.5 (50.9) | 13.5 (56.3) | 12.5 (54.5) | 7.5 (45.5) | 2.0 (35.6) | −4.2 (24.4) | −12.8 (9.0) | −0.8 (30.6) |
| Average precipitation mm (inches) | 86.6 (3.41) | 74.5 (2.93) | 76.1 (3.00) | 83.5 (3.29) | 115.9 (4.56) | 111.4 (4.39) | 121.4 (4.78) | 104.2 (4.10) | 115.5 (4.55) | 98.3 (3.87) | 102.5 (4.04) | 99.9 (3.93) | 1,189.7 (46.84) |
| Average snowfall cm (inches) | 71.9 (28.3) | 63.6 (25.0) | 46.4 (18.3) | 13.2 (5.2) | 0.0 (0.0) | 0.0 (0.0) | 0.0 (0.0) | 0.0 (0.0) | 0.0 (0.0) | 3.2 (1.3) | 32.7 (12.9) | 72.4 (28.5) | 303.4 (119.4) |
| Source: Environment and Climate Change Canada | |||||||||||||
| Climate data for Toronto (1981–2010) | |||||||||||||
|---|---|---|---|---|---|---|---|---|---|---|---|---|---|
| Month | Jan | Feb | Mar | Apr | May | Jun | Jul | Aug | Sep | Oct | Nov | Dec | Year |
| Average high °C (°F) | −0.7 (30.7) | 0.4 (32.7) | 4.7 (40.5) | 11.5 (52.7) | 18.4 (65.1) | 23.8 (74.8) | 26.6 (79.9) | 25.5 (77.9) | 21.0 (69.8) | 14.0 (57.2) | 7.5 (45.5) | 2.1 (35.8) | 12.9 (55.2) |
| Daily mean °C (°F) | −3.7 (25.3) | −2.6 (27.3) | 1.4 (34.5) | 7.9 (46.2) | 14.1 (57.4) | 19.4 (66.9) | 22.3 (72.1) | 21.5 (70.7) | 17.2 (63.0) | 10.7 (51.3) | 4.9 (40.8) | −0.5 (31.1) | 9.4 (48.9) |
| Average low °C (°F) | −6.7 (19.9) | −5.6 (21.9) | −1.9 (28.6) | 4.1 (39.4) | 9.9 (49.8) | 14.9 (58.8) | 18.0 (64.4) | 17.4 (63.3) | 13.4 (56.1) | 7.4 (45.3) | 2.3 (36.1) | −3.1 (26.4) | 5.9 (42.6) |
| Average precipitation mm (inches) | 61.5 (2.42) | 55.4 (2.18) | 53.7 (2.11) | 68.0 (2.68) | 82.0 (3.23) | 70.9 (2.79) | 63.9 (2.52) | 81.1 (3.19) | 84.7 (3.33) | 64.4 (2.54) | 84.1 (3.31) | 61.5 (2.42) | 831.1 (32.72) |
| Average snowfall cm (inches) | 37.2 (14.6) | 27.0 (10.6) | 19.8 (7.8) | 5.0 (2.0) | 0.0 (0.0) | 0.0 (0.0) | 0.0 (0.0) | 0.0 (0.0) | 0.0 (0.0) | 0.1 (0.0) | 8.3 (3.3) | 24.1 (9.5) | 121.5 (47.8) |
| Source: Environment and Climate Change Canada | |||||||||||||
The Canadian Prairies
Including the southern and central parts of Manitoba, Saskatchewan, Alberta.
This region lies between the western shores of Lake Superior and the Rocky Mountains. It has the most continental climate of any part of Canada. Winters are long and severe, with minimum temperatures not much higher than those recorded further north in the Canadian Arctic. The relatively short summers are fairly warm with moderate rainfall, much of which comes in heavy showers. Summers are warm enough and just long enough to make this a major grain growing area. Like the Midwestern United States bordering it to the south, it has plenty of fine, sunny weather. Sunshine hours per day average three to four hours in winter and nine to ten hours in summer. Winter snowfall is comparatively light and the ground is often swept clear of snow by strong winds before the next snowfall arrives. The transition from summer to winter and from winter to summer is often very rapid, so the spring and autumn periods are very short.
Heading west, rainfall decreases to 450 mm (18 inches) in Manitoba and 350 mm (14 inches) in the other two prairie provinces, most of it during the months of May through August, the months when vegetation needs the most moisture. In winter there is much less snow than northern Ontario and Quebec, with slightly lower temperatures. Rainfall in southern Saskatchewan and Alberta is much more variable than further east and north, causing droughts in some years.
The Winnipeg, Regina and Edmonton climates are representative of this region. In southern Alberta, however, the winter chill is often broken by chinooks, westerly winds that have lost their moisture by crossing the mountains and are warmed by rushing down to the plains, where they blow hard, stirring up the snow and raising the temperature. sometimes in a few hours from -5° to +5°C (23° to 41°F). It can be very effective in melting snow quickly.
| Climate data for Winnipeg (1981–2010) | |||||||||||||
|---|---|---|---|---|---|---|---|---|---|---|---|---|---|
| Month | Jan | Feb | Mar | Apr | May | Jun | Jul | Aug | Sep | Oct | Nov | Dec | Year |
| Average high °C (°F) | −11.3 (11.7) | −8.1 (17.4) | −0.8 (30.6) | 10.9 (51.6) | 18.6 (65.5) | 23.2 (73.8) | 25.9 (78.6) | 25.4 (77.7) | 19.0 (66.2) | 10.5 (50.9) | −0.5 (31.1) | −8.5 (16.7) | 8.7 (47.7) |
| Daily mean °C (°F) | −16.4 (2.5) | −13.2 (8.2) | −5.8 (21.6) | 4.4 (39.9) | 11.6 (52.9) | 17.0 (62.6) | 19.7 (67.5) | 18.8 (65.8) | 12.7 (54.9) | 5.0 (41.0) | −4.9 (23.2) | −13.2 (8.2) | 3.0 (37.4) |
| Average low °C (°F) | −21.4 (−6.5) | −18.3 (−0.9) | −10.7 (12.7) | −2.0 (28.4) | 4.5 (40.1) | 10.7 (51.3) | 13.5 (56.3) | 12.1 (53.8) | 6.4 (43.5) | −0.5 (31.1) | −9.2 (15.4) | −17.8 (0.0) | −2.7 (27.1) |
| Average precipitation mm (inches) | 19.9 (0.78) | 13.8 (0.54) | 24.5 (0.96) | 30.0 (1.18) | 56.7 (2.23) | 90.0 (3.54) | 79.5 (3.13) | 77.0 (3.03) | 45.8 (1.80) | 37.5 (1.48) | 25.0 (0.98) | 21.5 (0.85) | 521.1 (20.52) |
| Average snowfall cm (inches) | 23.7 (9.3) | 12.5 (4.9) | 16.5 (6.5) | 10.6 (4.2) | 2.6 (1.0) | 0.0 (0.0) | 0.0 (0.0) | 0.0 (0.0) | 0.3 (0.1) | 4.8 (1.9) | 19.9 (7.8) | 23.0 (9.1) | 113.7 (44.8) |
| Source: Environment and Climate Change Canada | |||||||||||||
| Climate data for Regina (1981–2010) | |||||||||||||
|---|---|---|---|---|---|---|---|---|---|---|---|---|---|
| Month | Jan | Feb | Mar | Apr | May | Jun | Jul | Aug | Sep | Oct | Nov | Dec | Year |
| Average high °C (°F) | −9.3 (15.3) | −6.4 (20.5) | 0.4 (32.7) | 11.6 (52.9) | 18.5 (65.3) | 22.8 (73.0) | 25.8 (78.4) | 25.5 (77.9) | 19.1 (66.4) | 11.0 (51.8) | 0.1 (32.2) | −7.1 (19.2) | 9.3 (48.7) |
| Daily mean °C (°F) | −14.7 (5.5) | −11.7 (10.9) | −4.8 (23.4) | 4.8 (40.6) | 11.3 (52.3) | 16.2 (61.2) | 18.9 (66.0) | 18.1 (64.6) | 11.8 (53.2) | 4.3 (39.7) | −5.2 (22.6) | −12.4 (9.7) | 3.1 (37.6) |
| Average low °C (°F) | −20.1 (−4.2) | −17.0 (1.4) | −9.9 (14.2) | −2.0 (28.4) | 4.1 (39.4) | 9.5 (49.1) | 11.9 (53.4) | 10.7 (51.3) | 4.6 (40.3) | −2.4 (27.7) | −10.5 (13.1) | −17.7 (0.1) | −3.2 (26.2) | Average precipitation mm (inches) | 15.3 (0.60) | 9.4 (0.37) | 19.7 (0.78) | 24.1 (0.95) | 51.4 (2.02) | 70.9 (2.79) | 66.9 (2.63) | 44.8 (1.76) | 32.8 (1.29) | 24.5 (0.96) | 14.2 (0.56) | 15.7 (0.62) | 389.7 (15.34) |
| Average snowfall cm (inches) | 19.4 (7.6) | 11.4 (4.5) | 18.8 (7.4) | 6.9 (2.7) | 3.6 (1.4) | 0.0 (0.0) | 0.0 (0.0) | 0.0 (0.0) | 0.7 (0.3) | 6.9 (2.7) | 13.0 (5.1) | 19.5 (7.7) | 100.2 (39.4) |
| Source: Environment and Climate Change Canada | |||||||||||||
| Climate data for Edmonton (1981–2010) | |||||||||||||
|---|---|---|---|---|---|---|---|---|---|---|---|---|---|
| Month | Jan | Feb | Mar | Apr | May | Jun | Jul | Aug | Sep | Oct | Nov | Dec | Year |
| Average high °C (°F) | −6.3 (20.7) | −3.8 (25.2) | 1.2 (34.2) | 10.8 (51.4) | 17.4 (63.3) | 20.6 (69.1) | 22.8 (73.0) | 22.2 (72.0) | 17.4 (63.3) | 10.4 (50.7) | −0.1 (31.8) | −5.5 (22.1) | 8.9 (48.1) |
| Daily mean °C (°F) | −12.1 (10.2) | −9.9 (14.2) | −4.4 (24.1) | 4.2 (39.6) | 10.2 (50.4) | 14.1 (57.4) | 16.2 (61.2) | 15.2 (59.4) | 10.2 (50.4) | 3.8 (38.8) | −5.4 (22.3) | −11.0 (12.2) | 2.6 (36.7) |
| Average low °C (°F) | −17.7 (0.1) | −15.9 (3.4) | −10.0 (14.0) | −2.5 (27.5) | 3.0 (37.4) | 7.6 (45.7) | 9.5 (49.1) | 8.1 (46.6) | 3.0 (37.4) | −2.9 (26.8) | −10.6 (12.9) | −16.5 (2.3) | −3.7 (25.3) |
| Average precipitation mm (inches) | 20.8 (0.82) | 11.9 (0.47) | 16.5 (0.65) | 28.7 (1.13) | 49.4 (1.94) | 72.7 (2.86) | 95.6 (3.76) | 54.9 (2.16) | 41.3 (1.63) | 22.6 (0.89) | 17.3 (0.68) | 14.5 (0.57) | 446.2 (17.56) |
| Average snowfall cm (inches) | 21.7 (8.5) | 13.4 (5.3) | 17.5 (6.9) | 14.4 (5.7) | 6.5 (2.6) | 0.0 (0.0) | 0.0 (0.0) | 0.1 (0.0) | 1.1 (0.4) | 10.4 (4.1) | 17.3 (6.8) | 15.9 (6.3) | 118.3 (46.6) |
| Source: Environment and Climate Change Canada | |||||||||||||
Canada west of the Prairies
Including Alberta within the Rocky Mountains, the southern and central parts of British Columbia.
This is a mountainous region with a heavily indented coastline on the Pacific Ocean. The highest mountains rise between 3,000 and 4,000 meters (10,000–13,000 feet) and are found in two ranges: the western or Coastal Mountains and the eastern or main range of the Rocky Mountains. The area in between consists of deep valleys and plateaus. Because of this varied relief and wide range of elevations, there are many local weather and climate variations. The coastal mountains have very heavy rainfall, and above 1,200 meters (4,000 feet) much of it is snow. Some of the valleys have very little annual rainfall; only 375 millimeters (15 inches).
Along the coast, the climate is maritime, with little frost in winter and mild heat in summer, and very heavy rainfall of 2,500 millimeters (100 inches) on the southwest side of Vancouver Island and near Port Simpson. Thus, this coastal region has the warmest winters in all of Canada. The weather and climate is very similar to that of the British Isles throughout the year, but summers are slightly warmer and sunnier. These mild winters are quickly giving way to harsh inland conditions with frequent snowfalls in the mountains and fairly low temperatures in the valleys where winter frosts are severe and frequent. This difference is well illustrated by the climate of Vancouver on the coast and Prince George, which lies far inland in the valley of the Fraser River. Winter minimum temperatures in Prince George are almost as low as on the prairies. Winter rainfall in Prince George is much less than on the coast.
This region is less sunny than much of central Canada. The winter sun is reduced by the more frequent cloudy days and fog is common on the coast. Summers are fairly sunny with an average of eight to nine hours a day compared to just two to three in winter. Although the weather is often changeable, this region has perhaps the most favorable climate in Canada; the coastal districts escape the harsh Canadian winters and summers are warm and rarely too hot or oppressive.
| Climate data for Vancouver (1981-2010) | |||||||||||||
|---|---|---|---|---|---|---|---|---|---|---|---|---|---|
| Month | Jan | Feb | Mar | Apr | May | Jun | Jul | Aug | Sep | Oct | Nov | Dec | Year |
| Average high °C (°F) | 6.9 (44.4) | 8.2 (46.8) | 10.3 (50.5) | 13.2 (55.8) | 16.7 (62.1) | 19.6 (67.3) | 22.2 (72.0) | 22.2 (72.0) | 18.9 (66.0) | 13.5 (56.3) | 9.2 (48.6) | 6.3 (43.3) | 13.9 (57.0) |
| Daily mean °C (°F) | 4.1 (39.4) | 4.9 (40.8) | 6.9 (44.4) | 9.4 (48.9) | 12.8 (55.0) | 15.7 (60.3) | 18.0 (64.4) | 18.0 (64.4) | 14.9 (58.8) | 10.3 (50.5) | 6.3 (43.3) | 3.6 (38.5) | 10.4 (50.7) |
| Average low °C (°F) | 1.4 (34.5) | 1.6 (34.9) | 3.4 (38.1) | 5.6 (42.1) | 8.8 (47.8) | 11.7 (53.1) | 13.7 (56.7) | 13.8 (56.8) | 10.8 (51.4) | 7.0 (44.6) | 3.5 (38.3) | 0.8 (33.4) | 6.8 (44.2) |
| Average precipitation mm (inches) | 168.4 (6.63) | 104.6 (4.12) | 113.9 (4.48) | 88.5 (3.48) | 65.0 (2.56) | 53.8 (2.12) | 35.6 (1.40) | 36.7 (1.44) | 50.9 (2.00) | 120.8 (4.76) | 188.9 (7.44) | 161.9 (6.37) | 1,189 (46.81) |
| Average snowfall cm (inches) | 11.1 (4.4) | 6.3 (2.5) | 2.3 (0.9) | 0.3 (0.1) | 0.0 (0.0) | 0.0 (0.0) | 0.0 (0.0) | 0.0 (0.0) | 0.0 (0.0) | 0.1 (0.0) | 3.2 (1.3) | 14.8 (5.8) | 38.1 (15.0) |
| Source: Environment and Climate Change Canada | |||||||||||||
| Climate data for Prince George (1981–2010) | |||||||||||||
|---|---|---|---|---|---|---|---|---|---|---|---|---|---|
| Month | Jan | Feb | Mar | Apr | May | Jun | Jul | Aug | Sep | Oct | Nov | Dec | Year |
| Average high °C (°F) | −2.9 (26.8) | 0.8 (33.4) | 6.3 (43.3) | 12.3 (54.1) | 17.6 (63.7) | 20.9 (69.6) | 23.1 (73.6) | 22.7 (72.9) | 17.3 (63.1) | 10.0 (50.0) | 1.8 (35.2) | −2.3 (27.9) | 10.6 (51.1) |
| Daily mean °C (°F) | −6.7 (19.9) | −3.7 (25.3) | 0.8 (33.4) | 5.9 (42.6) | 10.9 (51.6) | 14.6 (58.3) | 16.6 (61.9) | 16.0 (60.8) | 11.2 (52.2) | 5.4 (41.7) | −1.5 (29.3) | −5.8 (21.6) | 5.3 (41.5) |
| Average low °C (°F) | −10.5 (13.1) | −8.1 (17.4) | −4.8 (23.4) | −0.5 (31.1) | 4.2 (39.6) | 8.2 (46.8) | 10.0 (50.0) | 9.1 (48.4) | 5.0 (41.0) | 0.7 (33.3) | −4.8 (23.4) | −9.3 (15.3) | −0.1 (31.8) |
| Average precipitation mm (inches) | 54.4 (2.14) | 29.0 (1.14) | 27.4 (1.08) | 32.8 (1.29) | 42.4 (1.67) | 61.3 (2.41) | 58.9 (2.32) | 45.9 (1.81) | 53.7 (2.11) | 60.5 (2.38) | 47.7 (1.88) | 44.1 (1.74) | 558.1 (21.97) |
| Average snowfall cm (inches) | 42.7 (16.8) | 20.5 (8.1) | 11.8 (4.6) | 2.5 (1.0) | 0.3 (0.1) | 0.0 (0.0) | 0.0 (0.0) | 0.0 (0.0) | 0.1 (0.0) | 4.5 (1.8) | 22.8 (9.0) | 36.9 (14.5) | 142.0 (55.9) |
| Source: Environment and Climate Change Canada | |||||||||||||
Northern Canada
Including the Yukon, the Northwest Territories, Nunavut, the northern parts of British Columbia, Alberta, Saskatchewan, Manitoba, Ontario, Québec.
This region covers at least two thirds of Canada but is very sparsely populated due to the harsh climate. It is similar to the climate of northern Russia. In the south, the country consists of a vast area of coniferous forest, to the north lies the Atlantic tundra region, which is covered with snow eight to nine months of the year. However, there is so little rainfall that snow does not accumulate year-round, as the summer sun has warmth enough to thaw what falls in winter.
In the far north, the islands of the Arctic archipelago west of Greenland are covered in snow and ice all year round. The harsh conditions during the long winter are illustrated by the temperatures for Churchill on the Hudson Bay coast and for Iqaluit on the Baffin Island coast. Temperatures can rise to quite high levels during the short summer. However, for much of the summer, the weather can be changeable and disruptive. Snow and frost can occur any month as cold air is pulled down from the polar regions.
Permafrost is widespread in the north of this region. The top two or three feet of the ground thaws during the summer, but underneath the ground is frozen. The line marking the approximate southern limit of permafrost runs northwest-southeast from the Yukon and Great Slave Lakes to the south shore of Hudson Bay and then east to the Labrador coast.
Wind chill is a common and probably the most dangerous weather hazard in northern Canada. During severe winter weather, this can be a serious problem in most parts of the country except the west coast. A combination of low temperatures and strong winds is much more dangerous than very low temperatures with no wind or very light winds.
| Climate data for Yellowknife (1981–2010) | |||||||||||||
|---|---|---|---|---|---|---|---|---|---|---|---|---|---|
| Month | Jan | Feb | Mar | Apr | May | Jun | Jul | Aug | Sep | Oct | Nov | Dec | Year |
| Average high °C (°F) | −21.6 (−6.9) | −18.1 (−0.6) | −10.8 (12.6) | 0.4 (32.7) | 9.7 (49.5) | 18.1 (64.6) | 21.3 (70.3) | 18.1 (64.6) | 10.4 (50.7) | 0.9 (33.6) | −10.0 (14.0) | −17.8 (0.0) | 0.0 (32.0) |
| Daily mean °C (°F) | −25.6 (−14.1) | −22.9 (−9.2) | −16.8 (1.8) | −5.3 (22.5) | 4.6 (40.3) | 13.3 (55.9) | 17.0 (62.6) | 14.2 (57.6) | 7.2 (45.0) | −1.7 (28.9) | −13.7 (7.3) | −21.8 (−7.2) | −4.3 (24.3) |
| Average low °C (°F) | −29.5 (−21.1) | −27.5 (−17.5) | −22.7 (−8.9) | −11.0 (12.2) | −0.5 (31.1) | 8.5 (47.3) | 12.6 (54.7) | 10.2 (50.4) | 4.0 (39.2) | −4.2 (24.4) | −17.5 (0.5) | −25.7 (−14.3) | −8.6 (16.5) |
| Average precipitation mm (inches) | 14.3 (0.56) | 14.1 (0.56) | 13.9 (0.55) | 11.3 (0.44) | 18.4 (0.72) | 28.9 (1.14) | 40.8 (1.61) | 39.3 (1.55) | 36.3 (1.43) | 30.3 (1.19) | 24.8 (0.98) | 16.2 (0.64) | 288.6 (11.36) |
| Average snowfall cm (inches) | 19.7 (7.8) | 20.0 (7.9) | 18.5 (7.3) | 10.3 (4.1) | 4.7 (1.9) | 0.0 (0.0) | 0.0 (0.0) | 0.1 (0.0) | 3.5 (1.4) | 20.9 (8.2) | 36.5 (14.4) | 23.5 (9.3) | 157.6 (62.0) |
| Source: Environment and Climate Change Canada | |||||||||||||
| Climate data for Churchill, Manitoba, (1981−2010) | |||||||||||||
|---|---|---|---|---|---|---|---|---|---|---|---|---|---|
| Month | Jan | Feb | Mar | Apr | May | Jun | Jul | Aug | Sep | Oct | Nov | Dec | Year |
| Average high °C (°F) | −21.9 (−7.4) | −20.2 (−4.4) | −13.9 (7.0) | −5.1 (22.8) | 2.9 (37.2) | 12.0 (53.6) | 18.0 (64.4) | 16.8 (62.2) | 9.5 (49.1) | 1.6 (34.9) | −9.0 (15.8) | −17.8 (0.0) | −2.3 (27.9) |
| Daily mean °C (°F) | −26.0 (−14.8) | −24.5 (−12.1) | −18.9 (−2.0) | −9.8 (14.4) | −1.0 (30.2) | 7.0 (44.6) | 12.7 (54.9) | 12.3 (54.1) | 6.4 (43.5) | −1.2 (29.8) | −12.7 (9.1) | −21.9 (−7.4) | −6.5 (20.3) |
| Average low °C (°F) | −30.1 (−22.2) | −28.8 (−19.8) | −23.9 (−11.0) | −14.4 (6.1) | −5.0 (23.0) | 2.0 (35.6) | 7.3 (45.1) | 7.7 (45.9) | 3.2 (37.8) | −3.9 (25.0) | −16.4 (2.5) | −25.9 (−14.6) | −10.7 (12.7) |
| Average precipitation mm (inches) | 18.7 (0.74) | 16.6 (0.65) | 18.1 (0.71) | 23.6 (0.93) | 30.0 (1.18) | 44.2 (1.74) | 59.8 (2.35) | 69.4 (2.73) | 69.9 (2.75) | 48.4 (1.91) | 35.5 (1.40) | 18.4 (0.72) | 452.5 (17.81) |
| Average snowfall cm (inches) | 21.7 (8.5) | 19.3 (7.6) | 20.4 (8.0) | 24.9 (9.8) | 15.5 (6.1) | 3.3 (1.3) | 0.0 (0.0) | 0.0 (0.0) | 4.2 (1.7) | 29.8 (11.7) | 39.2 (15.4) | 22.9 (9.0) | 201.2 (79.2) |
| Source: Environment and Climate Change Canada | |||||||||||||
| Climate data for Iqaluit (1981–2010) | |||||||||||||
|---|---|---|---|---|---|---|---|---|---|---|---|---|---|
| Month | Jan | Feb | Mar | Apr | May | Jun | Jul | Aug | Sep | Oct | Nov | Dec | Year |
| Average high °C (°F) | −22.8 (−9.0) | −23.3 (−9.9) | −18.3 (−0.9) | −9.4 (15.1) | −1.2 (29.8) | 6.8 (44.2) | 12.3 (54.1) | 10.5 (50.9) | 5.2 (41.4) | −1.0 (30.2) | −8.3 (17.1) | −17.0 (1.4) | −5.6 (21.9) |
| Daily mean °C (°F) | −26.9 (−16.4) | −27.5 (−17.5) | −23.2 (−9.8) | −14.2 (6.4) | −4.4 (24.1) | 3.6 (38.5) | 8.2 (46.8) | 7.1 (44.8) | 2.6 (36.7) | −3.7 (25.3) | −12.0 (10.4) | −21.3 (−6.3) | −9.3 (15.3) |
| Average low °C (°F) | −30.9 (−23.6) | −31.7 (−25.1) | −28.1 (−18.6) | −18.9 (−2.0) | −7.6 (18.3) | 0.5 (32.9) | 4.1 (39.4) | 3.6 (38.5) | −0.1 (31.8) | −6.4 (20.5) | −15.8 (3.6) | −25.5 (−13.9) | −13.1 (8.4) |
| Average precipitation mm (inches) | 19.7 (0.78) | 18.7 (0.74) | 18.7 (0.74) | 27.5 (1.08) | 29.2 (1.15) | 33.0 (1.30) | 51.9 (2.04) | 69.5 (2.74) | 55.2 (2.17) | 33.3 (1.31) | 27.2 (1.07) | 19.9 (0.78) | 403.7 (15.89) |
| Average snowfall cm (inches) | 21.7 (8.5) | 21.0 (8.3) | 21.6 (8.5) | 31.5 (12.4) | 27.6 (10.9) | 9.3 (3.7) | 0.0 (0.0) | 0.9 (0.4) | 13.2 (5.2) | 29.4 (11.6) | 29.7 (11.7) | 23.4 (9.2) | 229.3 (90.3) |
| Source: Environment and Climate Change Canada | |||||||||||||
References
- E. A. Pearce, Charles Gordon Smith, (1990) The Hutchinson World Weather Guide, John Murray Press. ISBN 1859863426
- Timothy L. Gall, (ed.), (2003), Worldmark Encyclopedia of the Nations, Eleventh Edition, Thomson Gale
- Hugh Chisholm, (ed.), (1911), Encyclopædia Britannica, Eleventh edition, Cambridge University Press
The Climate of
Canada
In summary:
Canada's continental climate is sub-artic to arctic in the north, while near the U.S. border a narrow strip has a temperate climate with cold winters. The east and west coasts are maritime and more temperate. The north Canadian coast is permanently icebound, except for Hudson Bay, which is frozen for only nine months of the year.
On the Atlantic coast, the winter temperatures are warmer than those of the interior, but the summer temperatures are lower. Much of the southern interior of Canada has high summer temperatures and long, cold winters. The west coast of the country and some inland valleys have mild winters and mild summers with rainfall occurring throughout the year.