The Climate of
Indonesia
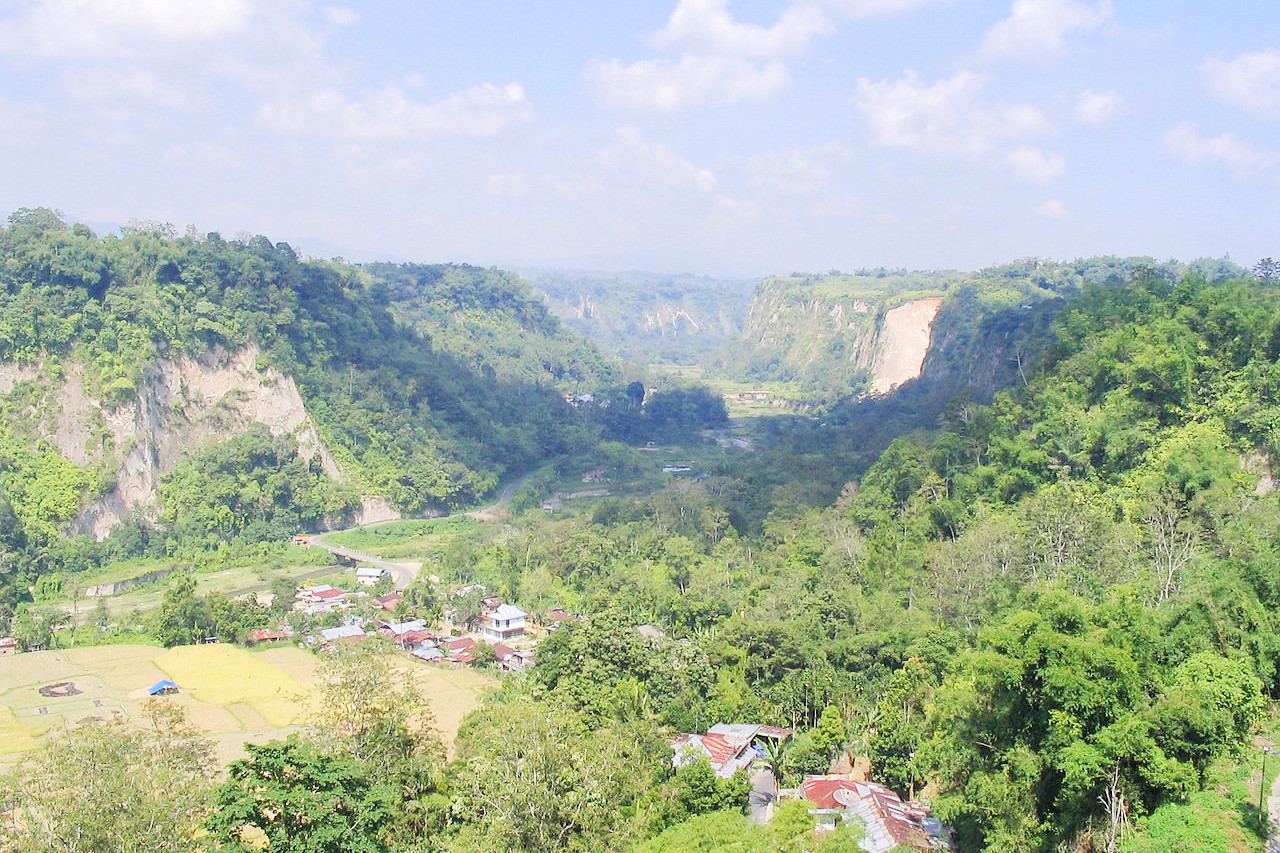 Sianok Canyon, in Bukittingi, West Sumatra
Climate Map
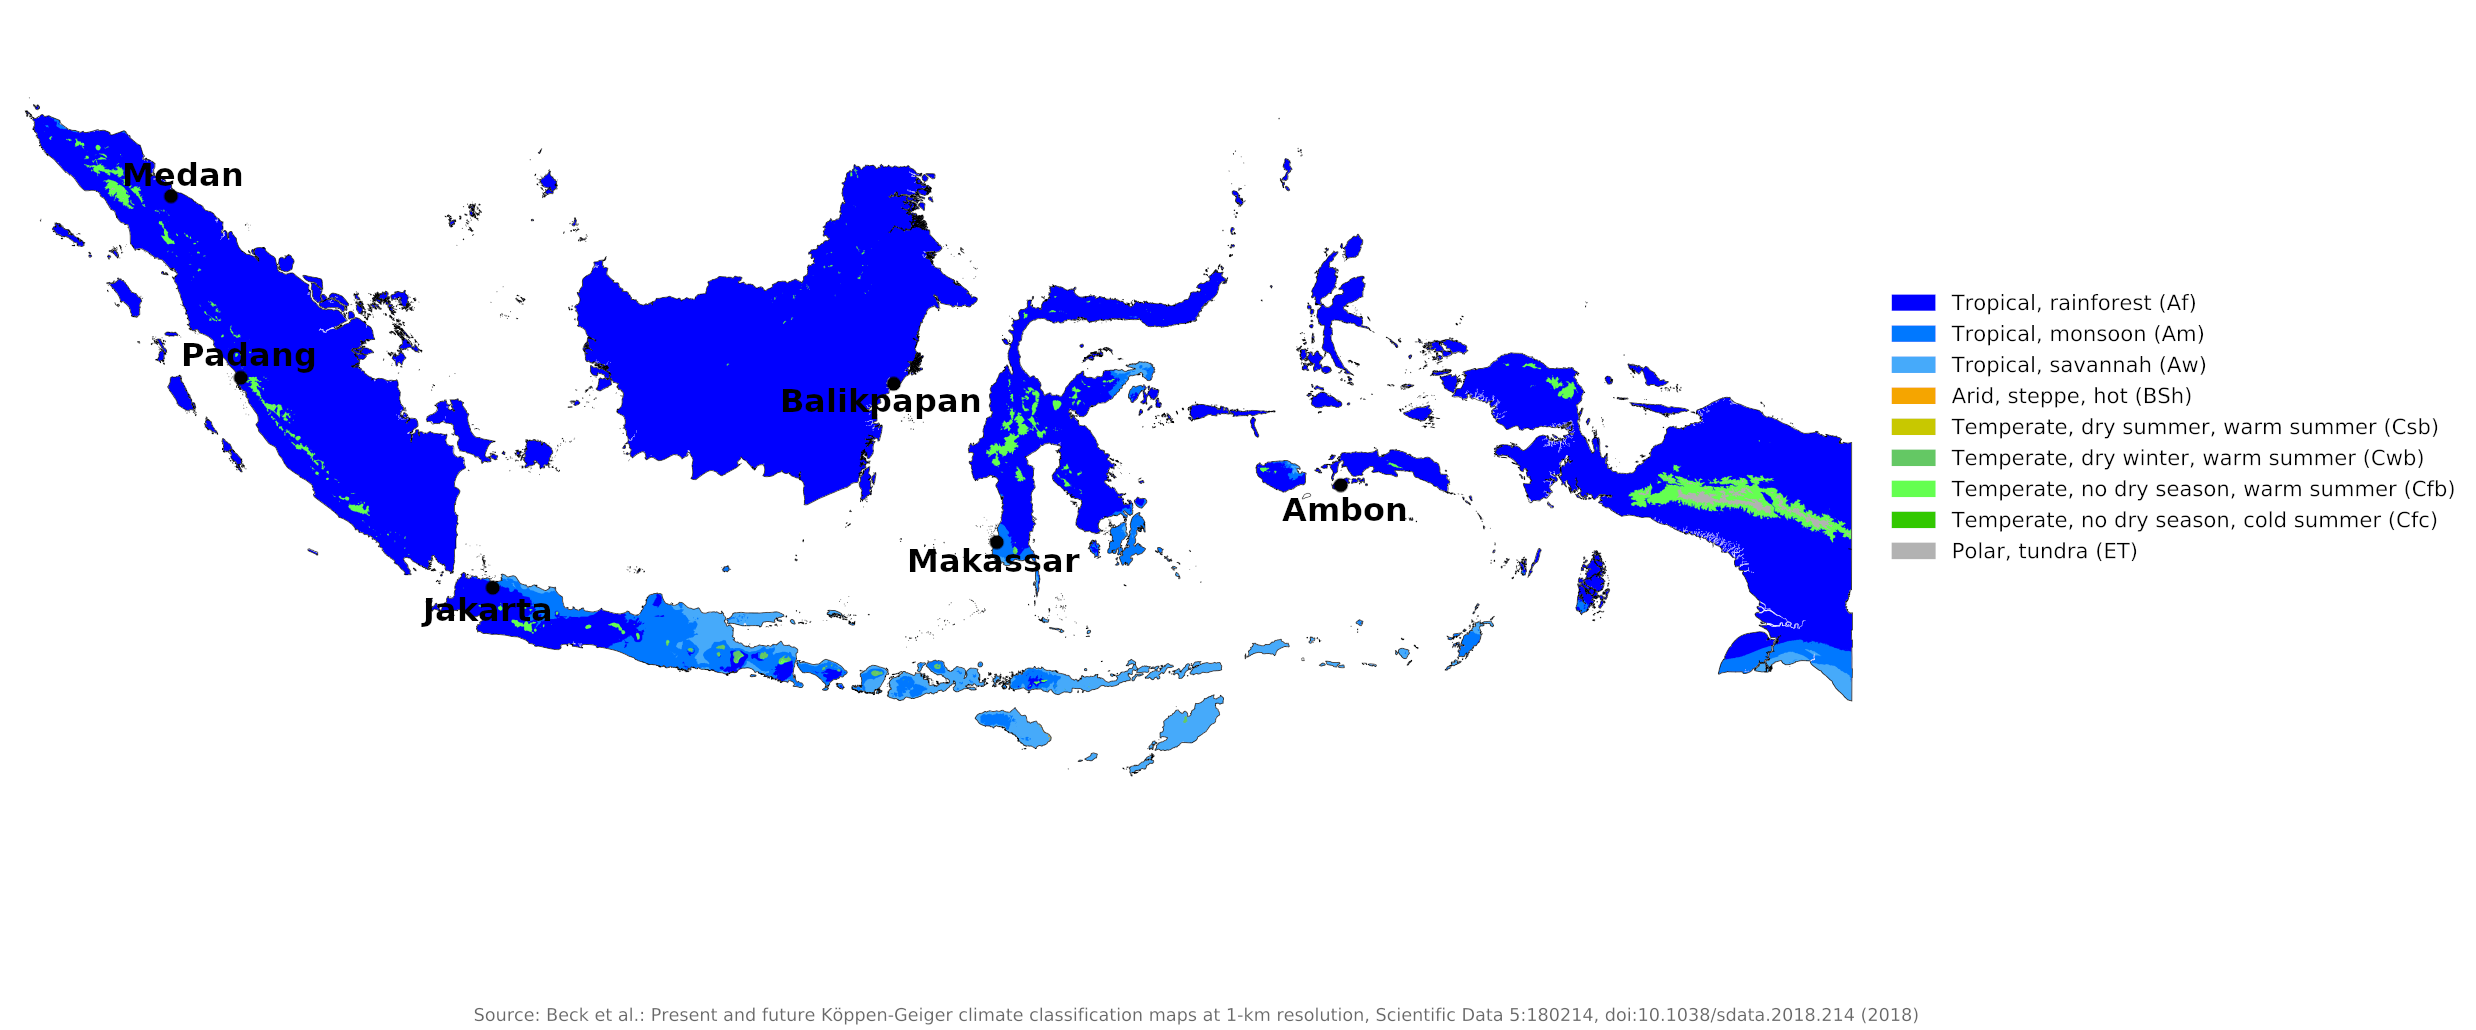 Climate map of Indonesia
What is the climate of Indonesia like?
Indonesia is about half the size of India and consists of a large number of islands between 5°N and 10°S of the equator, spanning 45° longitude. The largest islands from west to east are Sumatra, Java, Borneo and Sulawesi, but there are over 3,000 smaller islands, of which Bali and the Moluccas are the best known. Indonesia also includes the western part (Indonesian Papua) of the large island of New Guinea. Indonesia shares land borders with Malaysia to the north and Papua New Guinea to the east.
Traversed by the equator, Indonesia has an almost entirely tropical climate. The warm waters that surround Indonesia ensure that temperatures on land remain fairly constant. Most of the islands are very mountainous, with numerous volcanic peaks and other mountain ranges exceeding 3,000 meters (10,000 feet). Consequently, there are many sharp local climate differences within Indonesia; Not only are temperatures much lower in the hills, but the amount and season of maximum rainfall varies with the islands' varying exposure to the two main seasonal wind systems.
The entire archipelago is alternately dominated by the monsoons. There is a dry season (June to September) influenced by Australian continental air masses and a wet season (December to March) influenced by air masses from mainland Asia and the Pacific Ocean. The resulting monsoons are reinforced by humid Indian Ocean breezes, which produce significant amounts of rain in many parts of the archipelago. However, local conditions in Indonesia can greatly alter these patterns, particularly in the central islands of the Maluku Group.
During the dry monsoon, high pressure over the Australian deserts moves the winds northwest of Australia. When the winds reach the equator, the Earth's rotation causes them to turn from their original course in a northeasterly direction toward mainland Southeast Asia. During the wet monsoon, a corresponding high-pressure system over mainland Asia reverses the pattern. For a few weeks around April and October, the winds are light and change direction; This is the transitional period when the Doldrum Belt or Intertropical Convergence moves north or south across the islands.
Apart from the lower temperatures in the higher mountains, Indonesia's weather and climate are typical of equatorial regions. Temperatures in Indonesia's capital Jakarta generally range between 23°C (73°F) and 33°C (91°F). Precipitation is heavy almost everywhere and well distributed throughout the year. Most places receive 1,500 to 4,000 millimeters (60 to 160 inches) of rain per year. The highest mountain in western New Guinea even carries a permanent snowfield, although it is almost at the level of the equator.
| Climate data for Jakarta | |||||||||||||
|---|---|---|---|---|---|---|---|---|---|---|---|---|---|
| Month | Jan | Feb | Mar | Apr | May | Jun | Jul | Aug | Sep | Oct | Nov | Dec | Year |
| Average high °C (°F) | 28.9 (84.0) | 28.9 (84.0) | 29.4 (84.9) | 30.0 (86.0) | 30.6 (87.1) | 30.0 (86.0) | 30.0 (86.0) | 30.6 (87.1) | 31.1 (88.0) | 31.1 (88.0) | 30.6 (87.1) | 29.4 (84.9) | 30.1 (86.2) |
| Daily mean °C (°F) | 26.1 (79.0) | 26.1 (79.0) | 26.4 (79.5) | 27.0 (80.6) | 27.2 (81.0) | 26.7 (80.1) | 26.4 (79.5) | 26.7 (80.1) | 27.0 (80.6) | 27.2 (81.0) | 27.0 (80.6) | 26.4 (79.5) | 26.7 (80.1) |
| Average low °C (°F) | 23.3 (73.9) | 23.3 (73.9) | 23.3 (73.9) | 23.9 (75.0) | 23.9 (75.0) | 23.3 (73.9) | 22.8 (73.0) | 22.8 (73.0) | 22.8 (73.0) | 23.3 (73.9) | 23.3 (73.9) | 23.3 (73.9) | 23.3 (73.9) |
| Average precipitation mm (inches) | 300.7 (11.84) | 294.7 (11.60) | 210.8 (8.30) | 147.3 (5.80) | 132.1 (5.20) | 96.5 (3.80) | 63.5 (2.50) | 43.2 (1.70) | 66.0 (2.60) | 110.8 (4.36) | 142.2 (5.60) | 208.2 (8.20) | 1,816 (71.5) |
| Source: Sistema de Clasificación Bioclimática Mundial | |||||||||||||
Many places have two wetter periods during the passage of the Doldrum Belt; but southern coasts and islands south of the equator tend to be wetter during the southern monsoon season, and northern coasts and the northern islands are wetter during the northern monsoon season. Some of the islands of southern Maluku experience highly unpredictable rainfall patterns, depending on local wind currents. Compare Jakarta on the north coast of Java with Ambon in the Maluku islands (Moluccas) and Balikpapan on the southeast coast of Borneo. Makassar represents conditions in southern Sulawesi.
| Climate data for Ambon, Maluku | |||||||||||||
|---|---|---|---|---|---|---|---|---|---|---|---|---|---|
| Month | Jan | Feb | Mar | Apr | May | Jun | Jul | Aug | Sep | Oct | Nov | Dec | Year |
| Average high °C (°F) | 31.3 (88.3) | 31.4 (88.5) | 31.1 (88.0) | 30.7 (87.3) | 29.8 (85.6) | 28.5 (83.3) | 27.5 (81.5) | 27.8 (82.0) | 29.1 (84.4) | 30.3 (86.5) | 31.1 (88.0) | 31.5 (88.7) | 30.0 (86.0) |
| Daily mean °C (°F) | 27.0 (80.6) | 27.0 (80.6) | 26.9 (80.4) | 26.7 (80.1) | 26.4 (79.5) | 25.6 (78.1) | 25.0 (77.0) | 25.1 (77.2) | 25.7 (78.3) | 26.5 (79.7) | 27.0 (80.6) | 27.2 (81.0) | 26.3 (79.3) |
| Average low °C (°F) | 24.1 (75.4) | 24.1 (75.4) | 23.8 (74.8) | 23.9 (75.0) | 24.0 (75.2) | 23.6 (74.5) | 23.2 (73.8) | 23.1 (73.6) | 23.3 (73.9) | 23.8 (74.8) | 24.1 (75.4) | 24.2 (75.6) | 23.8 (74.8) |
| Average precipitation mm (inches) | 127 (5.0) | 119 (4.7) | 135 (5.3) | 279 (11.0) | 516 (20.3) | 638 (25.1) | 602 (23.7) | 401 (15.8) | 241 (9.5) | 155 (6.1) | 114 (4.5) | 132 (5.2) | 3,459 (136.2) |
| Source: Deutscher Wetterdienst | |||||||||||||
| Climate data for Balikpapan, Kalimantan | |||||||||||||
|---|---|---|---|---|---|---|---|---|---|---|---|---|---|
| Month | Jan | Feb | Mar | Apr | May | Jun | Jul | Aug | Sep | Oct | Nov | Dec | Year |
| Average high °C (°F) | 29.9 (85.8) | 30.2 (86.4) | 30.2 (86.4) | 30.2 (86.4) | 30.1 (86.2) | 29.5 (85.1) | 29.0 (84.2) | 29.5 (85.1) | 29.6 (85.3) | 30.3 (86.5) | 30.2 (86.4) | 30.1 (86.2) | 29.9 (85.8) |
| Daily mean °C (°F) | 26.5 (79.7) | 26.6 (79.9) | 26.6 (79.9) | 26.8 (80.2) | 26.9 (80.4) | 26.5 (79.7) | 26.1 (79.0) | 26.4 (79.5) | 26.5 (79.7) | 27.0 (80.6) | 26.9 (80.4) | 26.7 (80.1) | 26.6 (79.9) |
| Average low °C (°F) | 23.1 (73.6) | 23.0 (73.4) | 23.1 (73.6) | 23.4 (74.1) | 23.7 (74.7) | 23.6 (74.5) | 23.2 (73.8) | 23.4 (74.1) | 23.5 (74.3) | 23.7 (74.7) | 23.4 (74.1) | 23.3 (73.9) | 23.4 (74.1) |
| Average precipitation mm (inches) | 187 (7.4) | 172 (6.8) | 249 (9.8) | 196 (7.7) | 223 (8.8) | 265 (10.4) | 244 (9.6) | 230 (9.1) | 221 (8.7) | 140 (5.5) | 177 (7.0) | 235 (9.3) | 2,539 (100.1) |
| Source: Climate-Data.org | |||||||||||||
| Climate data for Makassar, Sulawesi | |||||||||||||
|---|---|---|---|---|---|---|---|---|---|---|---|---|---|
| Month | Jan | Feb | Mar | Apr | May | Jun | Jul | Aug | Sep | Oct | Nov | Dec | Year |
| Average high °C (°F) | 30.7 (87.3) | 31.0 (87.8) | 31.3 (88.3) | 32.0 (89.6) | 32.1 (89.8) | 32.5 (90.5) | 33.4 (92.1) | 34.3 (93.7) | 34.8 (94.6) | 34.6 (94.3) | 33.5 (92.3) | 31.3 (88.3) | 32.6 (90.7) |
| Daily mean °C (°F) | 26.9 (80.4) | 26.9 (80.4) | 27.3 (81.1) | 27.8 (82.0) | 27.8 (82.0) | 27.7 (81.9) | 27.1 (80.8) | 27.2 (81.0) | 28.0 (82.4) | 28.1 (82.6) | 28.1 (82.6) | 27.1 (80.8) | 27.5 (81.5) |
| Average low °C (°F) | 23.2 (73.8) | 22.7 (72.9) | 23.3 (73.9) | 23.6 (74.5) | 23.4 (74.1) | 22.9 (73.2) | 21.7 (71.1) | 20.1 (68.2) | 21.2 (70.2) | 21.7 (71.1) | 22.7 (72.9) | 23.0 (73.4) | 22.5 (72.4) |
| Average precipitation mm (inches) | 734 (28.9) | 563 (22.2) | 391 (15.4) | 235 (9.3) | 97 (3.8) | 66 (2.6) | 48 (1.9) | 15 (0.6) | 32 (1.3) | 83 (3.3) | 273 (10.7) | 549 (21.6) | 3,086 (121.6) |
| Source: Weatherbase.com | |||||||||||||
Much of the precipitation is heavy and accompanied by thunder. Some parts of Indonesia experience more thunderstorms than anywhere else in the world. Despite the heavy rainfall, there are many hours of sunshine in Indonesia. Sunshine averages four to five hours a day during the wetter months, and up to eight or nine hours a day during dry periods. Jakarta, one of the drier places in the country, receives three times as much rain as London, but it falls on fewer days a year and for half as many hours. The South China Sea's fearsome typhoons dissipate before they reach Indonesian waters, and the storms that blow from time to time through the Torres Strait between Australia and New Guinea rarely travel further than the extreme south-eastern islands of the archipelago, so the seas of Indonesia are generally calm.
Temperatures remain high year round with little variation from month to month. There are only two types of weather in Indonesia: fair and sunny or cloudy and wet. Only the extreme southern islands like Sumba are affected by tropical cyclones; However, local gusts of wind may occur during thunderstorms. On the coast, the daily temperature variation is small, but increases inland and in the hills. The cooler inland nights and daytime sea breezes and strong monsoon winds offer the greatest relief from the heat and humidity of the coast.
The prevailing wind patterns interact with the local topography to produce significant variations in precipitation throughout the archipelago. In general, the western and northern parts of Indonesia experience the most rainfall as the monsoon clouds are heavy with moisture when they reach these more distant regions. On the other hand, the areas closest to Australia tend to be dry, with some areas receiving less than 1,000 millimeters of rainfall per year.
Rainfall in lowland areas averages 1,800 to 3,200 millimeters (70–125 inches) per year, increasing with elevation to an average of 6,000 millimeters (240 inches) in some mountain areas. Medan (east coast) and Padang (west coast) illustrate the conditions on the island of Sumatra. The weather can often feel muggy and oppressive to the visitor, but heat stress is not serious. Damp and humidity are the worst characteristics of the climate.
| Climate data for Medan, Sumatra | |||||||||||||
|---|---|---|---|---|---|---|---|---|---|---|---|---|---|
| Month | Jan | Feb | Mar | Apr | May | Jun | Jul | Aug | Sep | Oct | Nov | Dec | Year |
| Average high °C (°F) | 31.6 (88.9) | 32 (90) | 32.7 (90.9) | 32.9 (91.2) | 33.4 (92.1) | 33.3 (91.9) | 32.9 (91.2) | 33.3 (91.9) | 31.9 (89.4) | 31.7 (89.1) | 31 (88) | 30.9 (87.6) | 32.3 (90.1) |
| Daily mean °C (°F) | 25.5 (77.9) | 26.1 (79.0) | 26.6 (79.9) | 27.2 (81.0) | 27.2 (81.0) | 26.9 (80.4) | 26.9 (80.4) | 26.9 (80.4) | 26.6 (79.9) | 26.1 (79.0) | 26.1 (79.0) | 25.8 (78.4) | 26.5 (79.7) |
| Average low °C (°F) | 22.2 (72.0) | 22.6 (72.7) | 23.2 (73.8) | 23.5 (74.3) | 23.3 (73.9) | 23.6 (74.5) | 23.5 (74.3) | 22.8 (73.0) | 22.2 (72.0) | 22.6 (72.7) | 23 (73) | 22.5 (72.5) | 22.9 (73.2) |
| Average precipitation mm (inches) | 92 (3.6) | 115 (4.5) | 97 (3.8) | 157 (6.2) | 178 (7.0) | 141 (5.6) | 167 (6.6) | 185 (7.3) | 263 (10.4) | 387 (15.2) | 253 (10.0) | 228 (9.0) | 2,263 (89.2) |
| Source: World Meteorological Organization | |||||||||||||
| Climate data for Padang, Sumatra | |||||||||||||
|---|---|---|---|---|---|---|---|---|---|---|---|---|---|
| Month | Jan | Feb | Mar | Apr | May | Jun | Jul | Aug | Sep | Oct | Nov | Dec | Year |
| Average high °C (°F) | 30.6 (87.1) | 31.7 (89.1) | 31.7 (89.1) | 31.7 (89.1) | 32.2 (90.0) | 32.2 (90.0) | 31.7 (89.1) | 32.2 (90.0) | 32.2 (90.0) | 31.7 (89.1) | 31.1 (88.0) | 30.6 (87.1) | 31.6 (88.9) |
| Daily mean °C (°F) | 27.0 (80.6) | 27.0 (80.6) | 27.0 (80.6) | 27.2 (81.0) | 27.5 (81.5) | 27.0 (80.6) | 25.0 (77.0) | 25.0 (77.0) | 26.7 (80.1) | 26.7 (80.1) | 26.7 (80.1) | 26.7 (80.1) | 26.6 (79.9) |
| Average low °C (°F) | 23.3 (73.9) | 24.4 (75.9) | 23.9 (75.0) | 23.9 (75.0) | 23.9 (75.0) | 23.9 (75.0) | 23.3 (73.9) | 23.3 (73.9) | 23.9 (75.0) | 23.9 (75.0) | 23.9 (75.0) | 23.9 (75.0) | 23.8 (74.8) |
| Average precipitation> mm (inches) | 351 (13.8) | 259 (10.2) | 307 (12.1) | 363 (14.3) | 315 (12.4) | 307 (12.1) | 277 (10.9) | 348 (13.7) | 352 (13.9) | 495 (19.5) | 518 (20.4) | 480 (18.9) | 4,172 (164.3) |
| Source: Sistema de Clasificación Bioclimática Mundial | |||||||||||||
References
- E. A. Pearce, Charles Gordon Smith, (1990) The Hutchinson World Weather Guide, John Murray Press. ISBN 1859863426
- Timothy L. Gall, (ed.), (2003), Worldmark Encyclopedia of the Nations, Eleventh Edition, Thomson Gale
- Federal Research Division, Library of Congress, (2011), Indonesia: a country study. Claitor's Pub. Division. ISBN 9780844407906
- Hugh Chisholm, (ed.), (1911), Encyclopædia Britannica, Eleventh edition, Cambridge University Press
The Climate of
Indonesia
In summary:
Indonesia has a tropical climate, with high humidity and high temperatures. There are many sharp local differences of climate within Indonesia; not only are temperatures much lower in the hills, but the amount and season of maximum rainfall vary according to the two main seasonal wind systems.
The country is alternately dominated by the north monsoon, blowing from China and the north Pacific between November and March, and the south monsoon, blowing from the Indian Ocean and Australia between May and September. South-facing coasts and islands south of the equator tend to be wetter during the period of the south monsoon, and north-facing coasts and the northern islands are wetter during the period of the north monsoon.