The Climate of
Iran
 Entrance of Baghmeli in Nishapur
Climate Map
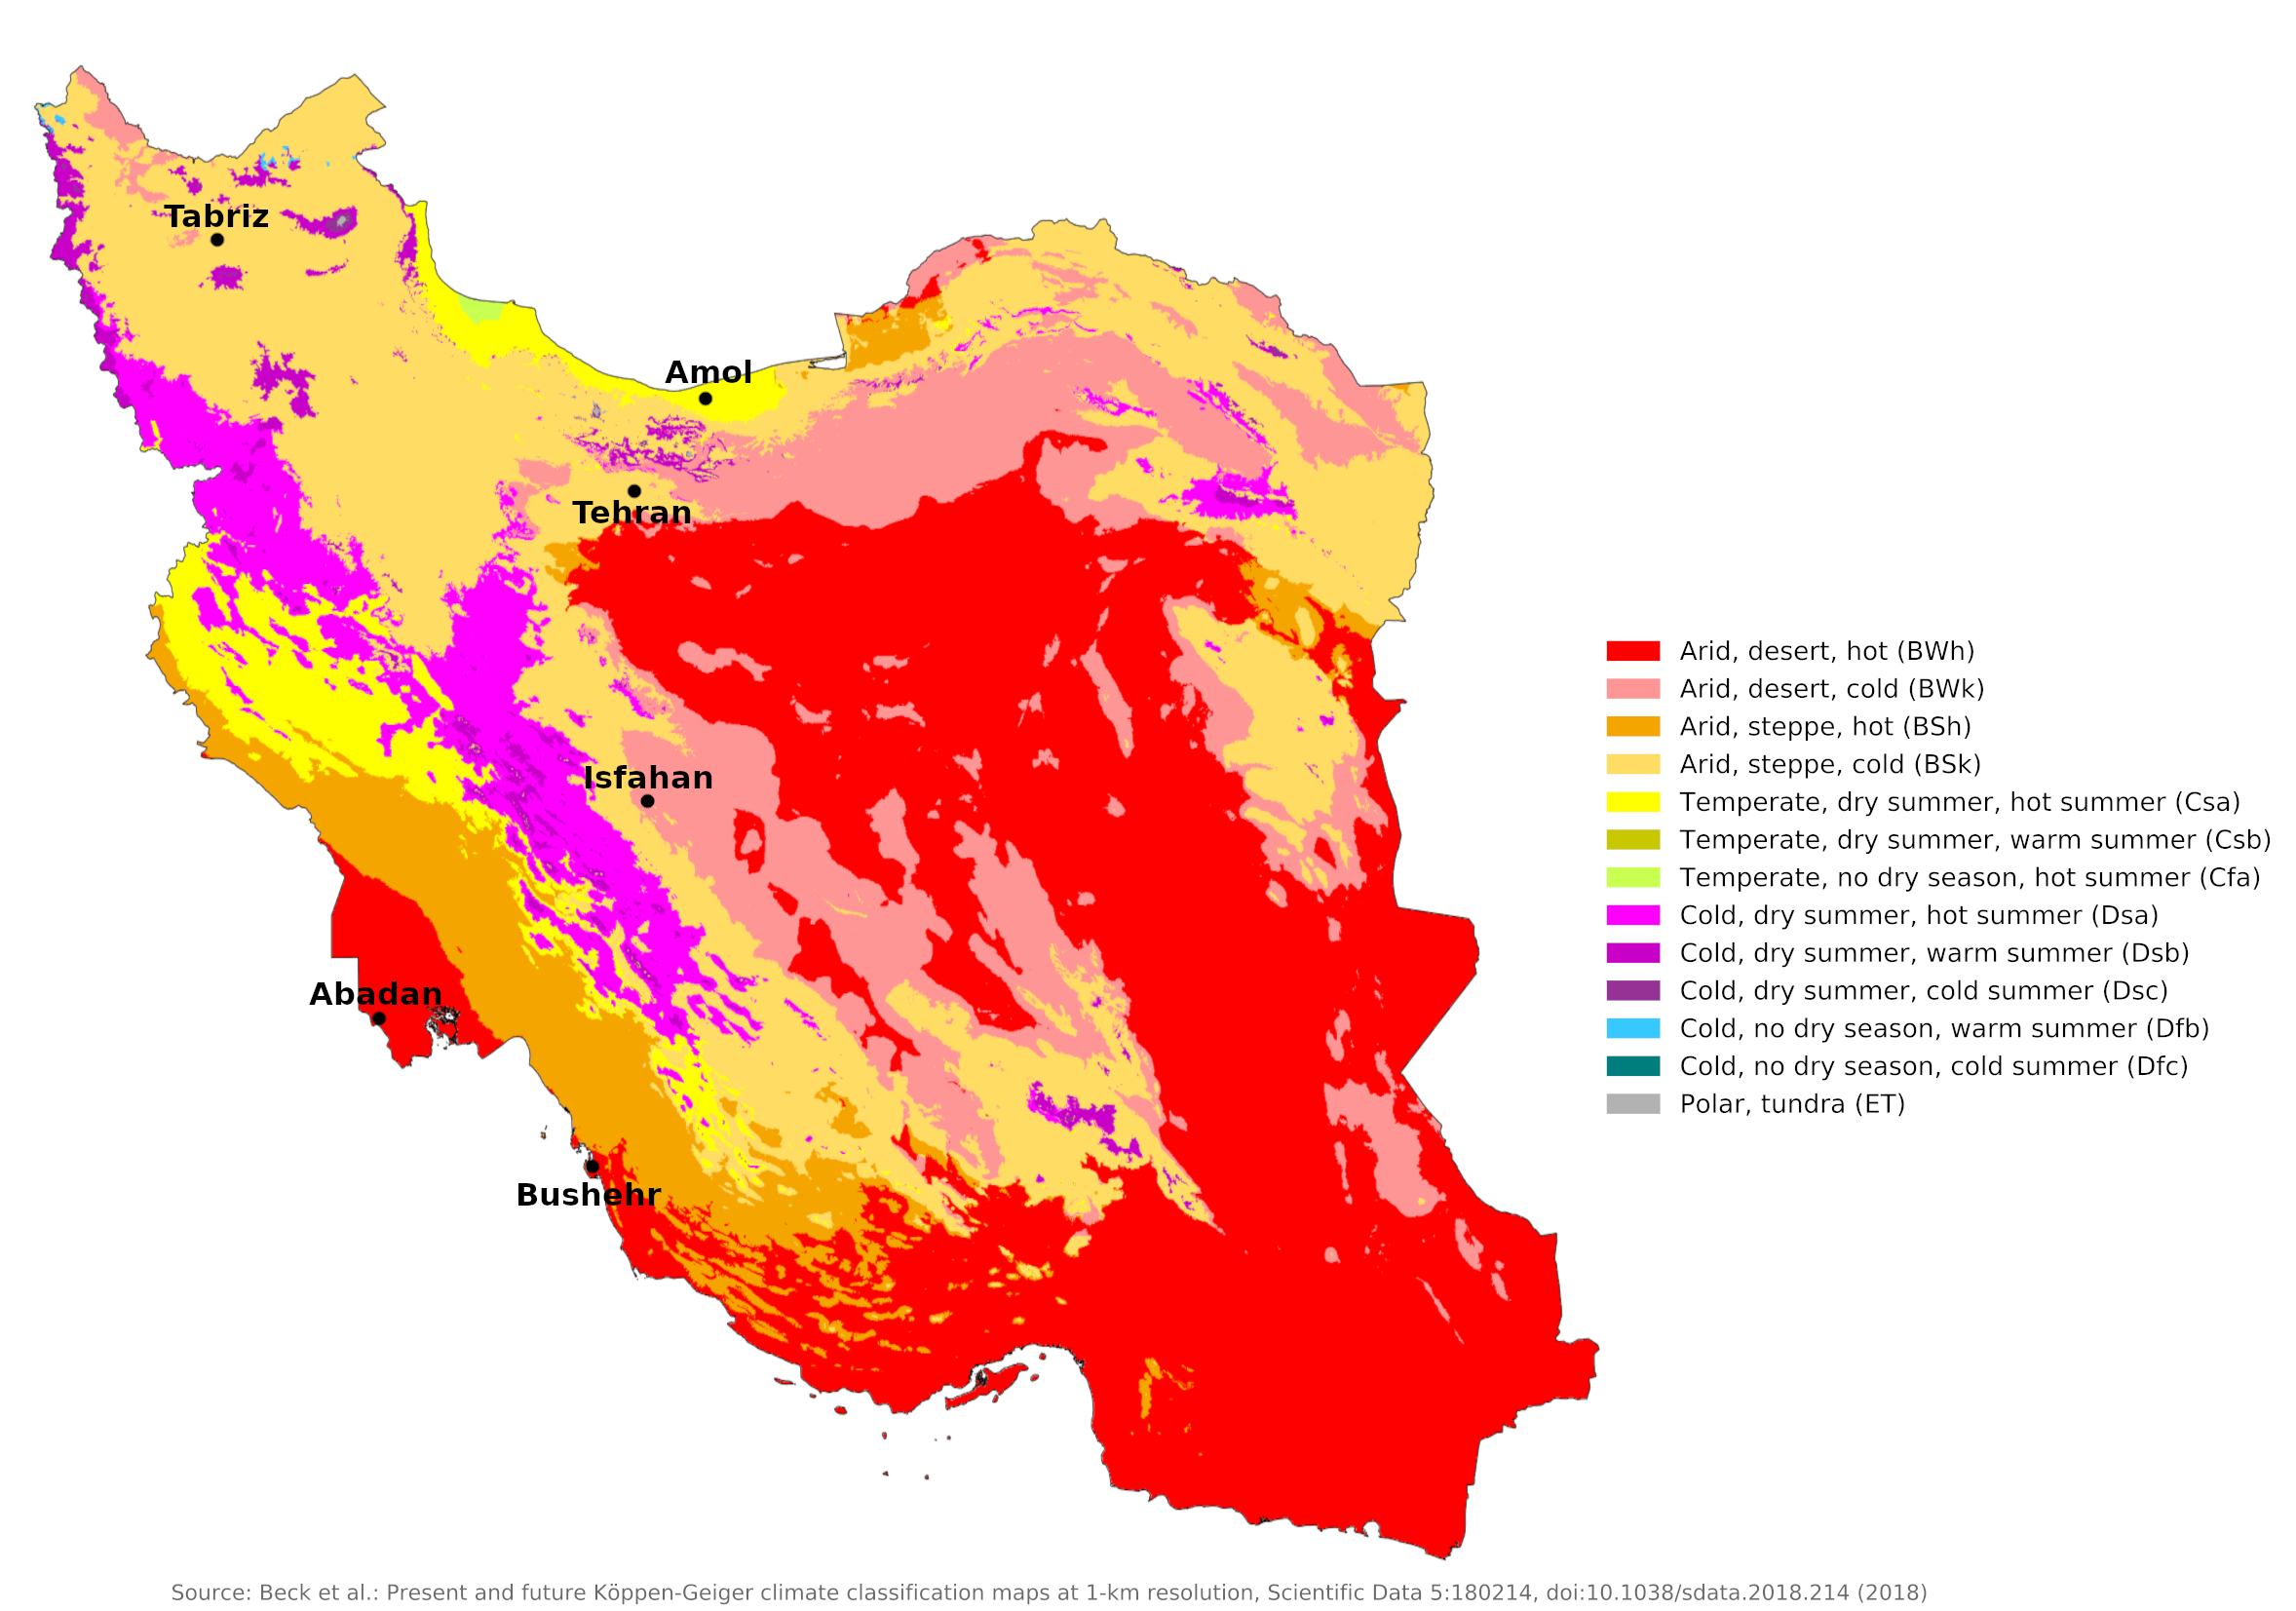 Climate map of Iran
What is the climate of Iran like?
Iran is a large country, three times the size of France. It is bordered by Turkmenistan and the Caspian Sea to the north, Afghanistan and Pakistan on the east, the Persian Gulf on the south, and Iraq and Turkey on the west. Much of the interior of the country consists of a high plateau between 900 and 1,500 meters (3,000–5,000 feet) above sea level.The Iranian plateau is surrounded by mountains on all sides: the Alborz ranges to the north and the Zagros to the west and south.In At higher elevations, these mountains rise between 3,000 and 4,600 meters (10,000–15,000 feet), allowing the winter snows to feed many of the country's rivers.
Much of Iran has an arid and semi-arid climate with great hot and cold extremes between summer and winter. There are four seasons: spring, summer, a short fall, and winter. The central deserts and the Persian Gulf coast are particularly hot in summer, with some of the world's highest recorded desert temperatures. Snow falls heavily on the mountain peaks and is the main source of water for irrigation in spring and early summer.
Large parts of central, southern and eastern Iran consist of desert and steppe with annual rainfall of less than 300 millimeters (12 inches). With the exception of the northern slopes of the Alborz Mountains and the Caspian coasts, precipitation is limited to the winter and spring months. In the extreme north of the country there is some rainfall throughout the year. Summers are warm to hot everywhere with almost continuous sunshine. Winter weather is changeable with a mix of mild, wet periods and some very cold weather with frost and snow when cold air blows from Siberia. Winters are much milder along the coasts of the Gulf and Arabian Seas, as evidenced by those for Abadan and Bushehr. The high summer temperatures here are similar to those in the lowlands of Iraq and there is a risk of heat exhaustion and even heatstroke.
| Climate data for Abadan (1951–2022) | |||||||||||||
|---|---|---|---|---|---|---|---|---|---|---|---|---|---|
| Month | Jan | Feb | Mar | Apr | May | Jun | Jul | Aug | Sep | Oct | Nov | Dec | Year |
| Average high °C (°F) | 18.1 (64.6) | 20.9 (69.6) | 25.9 (78.6) | 32.2 (90.0) | 39.2 (102.6) | 43.8 (110.8) | 45.4 (113.7) | 45.4 (113.7) | 42.5 (108.5) | 36.1 (97.0) | 26.8 (80.2) | 19.9 (67.8) | 33.0 (91.4) |
| Daily mean °C (°F) | 12.7 (54.9) | 15.0 (59.0) | 19.4 (66.9) | 25.2 (77.4) | 31.2 (88.2) | 35.2 (95.4) | 36.7 (98.1) | 36.3 (97.3) | 33.0 (91.4) | 27.5 (81.5) | 20.0 (68.0) | 14.3 (57.7) | 25.5 (77.9) |
| Average low °C (°F) | 7.3 (45.1) | 9.1 (48.4) | 13.0 (55.4) | 18.1 (64.6) | 23.3 (73.9) | 26.5 (79.7) | 28.0 (82.4) | 27.3 (81.1) | 23.4 (74.1) | 18.9 (66.0) | 13.2 (55.8) | 8.7 (47.7) | 18.1 (64.6) |
| Average precipitation mm (inches) | 35.5 (1.40) | 20.0 (0.79) | 19.2 (0.76) | 14.4 (0.57) | 3.2 (0.13) | 0.1 (0.00) | 0.0 (0.0) | 0.0 (0.0) | 0.1 (0.00) | 3.9 (0.15) | 20.5 (0.81) | 36.4 (1.43) | 153.3 (6.04) |
| Source: Iran Meteorological Organization | |||||||||||||
| Climate data for Bushehr (1951–2010) | |||||||||||||
|---|---|---|---|---|---|---|---|---|---|---|---|---|---|
| Month | Jan | Feb | Mar | Apr | May | Jun | Jul | Aug | Sep | Oct | Nov | Dec | Year |
| Average high °C (°F) | 18.6 (65.5) | 20.2 (68.4) | 24.2 (75.6) | 29.6 (85.3) | 34.5 (94.1) | 36.4 (97.5) | 37.8 (100.0) | 38.1 (100.6) | 36.6 (97.9) | 32.9 (91.2) | 26.6 (79.9) | 21.0 (69.8) | 29.7 (85.5) |
| Daily mean °C (°F) | 14.5 (58.1) | 15.8 (60.4) | 19.3 (66.7) | 24.3 (75.7) | 29.0 (84.2) | 31.4 (88.5) | 33.1 (91.6) | 33.3 (91.9) | 30.8 (87.4) | 26.9 (80.4) | 21.3 (70.3) | 16.5 (61.7) | 24.7 (76.5) |
| Average low °C (°F) | 10.3 (50.5) | 11.4 (52.5) | 14.4 (57.9) | 18.9 (66.0) | 23.6 (74.5) | 26.3 (79.3) | 28.4 (83.1) | 28.4 (83.1) | 25.1 (77.2) | 20.9 (69.6) | 16.0 (60.8) | 12.0 (53.6) | 19.6 (67.3) |
| Average precipitation mm (inches) | 78.5 (3.09) | 31.8 (1.25) | 22.4 (0.88) | 8.6 (0.34) | 2.6 (0.10) | 0.0 (0.0) | 0.0 (0.0) | 0.3 (0.01) | 0.0 (0.0) | 5.7 (0.22) | 39.4 (1.55) | 78.7 (3.10) | 268.0 (10.55) |
| Source: Iran Meteorological Organization | |||||||||||||
Temperatures on the inner plateau are significantly lower in winter but high during the long sunny summer (see Tehran and Isfahan). In the southern coastal countries, the high humidity makes the high summer temperatures even more uncomfortable. Inland, daytime humidity is usually fairly low in summer and the most dangerous conditions arise when high temperatures are combined with the occasional strong, dusty winds.
| Climate data for Tehran (1988–2005) | |||||||||||||
|---|---|---|---|---|---|---|---|---|---|---|---|---|---|
| Month | Jan | Feb | Mar | Apr | May | Jun | Jul | Aug | Sep | Oct | Nov | Dec | Year |
| Average high °C (°F) | 6.1 (43.0) | 8.1 (46.6) | 12.9 (55.2) | 19.8 (67.6) | 25.0 (77.0) | 31.2 (88.2) | 33.9 (93.0) | 33.5 (92.3) | 29.3 (84.7) | 22.4 (72.3) | 14.3 (57.7) | 8.6 (47.5) | 20.4 (68.8) |
| Daily mean °C (°F) | 2.3 (36.1) | 4.4 (39.9) | 9.2 (48.6) | 14.9 (58.8) | 19.8 (67.6) | 25.6 (78.1) | 28.5 (83.3) | 27.6 (81.7) | 23.4 (74.1) | 17.2 (63.0) | 9.9 (49.8) | 4.8 (40.6) | 15.6 (60.1) |
| Average low °C (°F) | −1.5 (29.3) | −0.2 (31.6) | 4.0 (39.2) | 9.8 (49.6) | 14 (57) | 19.6 (67.3) | 22.6 (72.7) | 21.9 (71.4) | 17.5 (63.5) | 11.6 (52.9) | 5.4 (41.7) | 1.0 (33.8) | 10.5 (50.8) |
| Average precipitation mm (inches) | 63.1 (2.48) | 66.5 (2.62) | 83.3 (3.28) | 50.1 (1.97) | 27.1 (1.07) | 4.0 (0.16) | 4.2 (0.17) | 3.2 (0.13) | 3.4 (0.13) | 16.5 (0.65) | 41.3 (1.63) | 66.3 (2.61) | 429 (16.9) |
| Source: Iran Meteorological Organization | |||||||||||||
| Climate data for Isfahan (1961–1990) | |||||||||||||
|---|---|---|---|---|---|---|---|---|---|---|---|---|---|
| Month | Jan | Feb | Mar | Apr | May | Jun | Jul | Aug | Sep | Oct | Nov | Dec | Year |
| Average high °C (°F) | 8.8 (47.8) | 11.9 (53.4) | 16.8 (62.2) | 22.0 (71.6) | 28.0 (82.4) | 34.1 (93.4) | 36.4 (97.5) | 35.1 (95.2) | 31.2 (88.2) | 24.4 (75.9) | 16.9 (62.4) | 10.8 (51.4) | 23.0 (73.4) |
| Daily mean °C (°F) | 2.7 (36.9) | 5.5 (41.9) | 10.4 (50.7) | 15.7 (60.3) | 21.3 (70.3) | 27.1 (80.8) | 29.4 (84.9) | 27.9 (82.2) | 23.5 (74.3) | 16.9 (62.4) | 9.9 (49.8) | 4.4 (39.9) | 16.2 (61.2) |
| Average low °C (°F) | −2.4 (27.7) | −0.2 (31.6) | 4.5 (40.1) | 9.4 (48.9) | 14.2 (57.6) | 19.1 (66.4) | 21.5 (70.7) | 19.8 (67.6) | 15.1 (59.2) | 9.3 (48.7) | 3.6 (38.5) | −0.9 (30.4) | 9.4 (48.9) |
| Average precipitation mm (inches) | 17.1 (0.67) | 14.1 (0.56) | 18.2 (0.72) | 19.2 (0.76) | 8.8 (0.35) | 0.6 (0.02) | 0.7 (0.03) | 0.2 (0.01) | 0.0 (0.0) | 4.1 (0.16) | 9.9 (0.39) | 19.6 (0.77) | 112.5 (4.43) |
| Source: NOAA | |||||||||||||
In the northwest and west, winters are cold, with heavy snowfall and subfreezing temperatures from December to February. Spring and fall are relatively mild, with rain in the early spring and late autumn. Summers are dry; days can be hot, but nights are mild to cool.
| Climate data for Tabriz (1951–2010) | |||||||||||||
|---|---|---|---|---|---|---|---|---|---|---|---|---|---|
| Month | Jan | Feb | Mar | Apr | May | Jun | Jul | Aug | Sep | Oct | Nov | Dec | Year |
| Average high °C (°F) | 2.3 (36.1) | 4.9 (40.8) | 10.6 (51.1) | 17.0 (62.6) | 22.8 (73.0) | 28.8 (83.8) | 32.8 (91.0) | 32.7 (90.9) | 28.3 (82.9) | 20.7 (69.3) | 12.0 (53.6) | 5.2 (41.4) | 18.2 (64.8) |
| Daily mean °C (°F) | −1.7 (28.9) | 0.5 (32.9) | 5.6 (42.1) | 11.5 (52.7) | 16.7 (62.1) | 22.1 (71.8) | 26.0 (78.8) | 25.9 (78.6) | 21.4 (70.5) | 14.5 (58.1) | 7.1 (44.8) | 1.2 (34.2) | 12.6 (54.7) |
| Average low °C (°F) | −5.7 (21.7) | −3.9 (25.0) | 0.6 (33.1) | 6.0 (42.8) | 10.7 (51.3) | 15.4 (59.7) | 19.3 (66.7) | 19.1 (66.4) | 14.5 (58.1) | 8.4 (47.1) | 2.1 (35.8) | −2.9 (26.8) | 7.0 (44.6) |
| Average precipitation mm (inches) | 22.0 (0.87) | 24.2 (0.95) | 40.0 (1.57) | 51.6 (2.03) | 41.1 (1.62) | 16.4 (0.65) | 5.6 (0.22) | 3.3 (0.13) | 7.9 (0.31) | 22.5 (0.89) | 27.1 (1.07) | 22.1 (0.87) | 283.8 (11.17) |
| Source: Iran Meteorological Organization | |||||||||||||
The small area of Iran along the Caspian coast has a very different climate than the rest of the country. Here, precipitation is heaviest from late summer to mid-winter and occurs year-round. This region is much wetter and cloudier than the interior and annual rainfall ranges from 800 to 2,000 millimeters (35 to 80 in). It is a fertile, forested region and contrasts strikingly with the arid landscape of interior Iran, where most agriculture depends on irrigation from underground water resources and streams fed by rain and snow falling on the surrounding mountains.
| Climate data for Amol | |||||||||||||
|---|---|---|---|---|---|---|---|---|---|---|---|---|---|
| Month | Jan | Feb | Mar | Apr | May | Jun | Jul | Aug | Sep | Oct | Nov | Dec | Year |
| Average high °C (°F) | 13.1 (55.6) | 12.5 (54.5) | 12.4 (54.3) | 16.2 (61.2) | 23.7 (74.7) | 27.7 (81.9) | 28.7 (83.7) | 30.3 (86.5) | 25.9 (78.6) | 23.2 (73.8) | 18.9 (66.0) | 15.1 (59.2) | 20.6 (69.2) |
| Daily mean °C (°F) | 8.7 (47.7) | 8.1 (46.6) | 8.2 (46.8) | 11.9 (53.4) | 19.1 (66.4) | 21.9 (71.4) | 24 (75) | 25.4 (77.7) | 21.1 (70.0) | 18.4 (65.1) | 13.8 (56.8) | 10.2 (50.4) | 15.9 (60.6) |
| Average low °C (°F) | 4.4 (39.9) | 3.8 (38.8) | 4 (39) | 7.7 (45.9) | 14.6 (58.3) | 16.2 (61.2) | 19.3 (66.7) | 20.6 (69.1) | 16.3 (61.3) | 13.6 (56.5) | 8.7 (47.7) | 5.4 (41.7) | 11.2 (52.2) |
| Average precipitation mm (inches) | 96 (3.8) | 80 (3.1) | 74 (2.9) | 69 (2.7) | 31 (1.2) | 27 (1.1) | 27 (1.1) | 36 (1.4) | 87 (3.4) | 97 (3.8) | 97 (3.8) | 108 (4.3) | 829 (32.6) |
| Source: Climate-Data.org | |||||||||||||
In general, the climate in Iran is dry; Most of the relatively low annual precipitation falls from October to April. Annual rainfall averages 250 millimeters or less in most parts of the country. Some basins of the central plateau get 100 millimeters or less. This dryness means that agriculture in most areas of Iran is dependent on irrigation.
Spring and autumn are fairly short seasons in Iran between the heat of summer and the more changeable and often cold weather of winter. These seasons are the best time to visit Iran, although the weather can occasionally be a bit uncertain, with brief lapses into either the chills of winter or the heat of summer. Strong seasonal winds often kick up dust and sandstorms.
References
- E. A. Pearce, Charles Gordon Smith, (1990) The Hutchinson World Weather Guide, John Murray Press. ISBN 1859863426
- Timothy L. Gall, (ed.), (2003), Worldmark Encyclopedia of the Nations, Eleventh Edition, Thomson Gale
- Federal Research Division, Library of Congress, (2008), Iran: a country study. Claitor's Pub. Division. ISBN 9780844411873
- Hugh Chisholm, (ed.), (1911), Encyclopædia Britannica, Eleventh edition, Cambridge University Press
The Climate of
Iran
In summary:
Iran has an arid and semiarid climate with subtropical areas along the coasts. There are four seasons: spring, summer, a brief autumn, and winter. The central deserts and Persian Gulf coast are especially hot in summer. The average annual temperature in southern Iran is between 25°C and 30°C (77°F and 86°F).
Iran’s climate is dry; on the plateau, the annual rainfall does not exceed 300 mm (12 in), with the deserts receiving less than 130 mm (5 in). The Caspian coast is warm and humid throughout the year, with annual rainfall around 1000 mm (40 in).