The Climate of
Thailand
.jpg) Wat Arun on the Chao Phra river, Bangkok
Wat Arun on the Chao Phra river, Bangkok
.jpg&oldid=637073104)
Climate Map
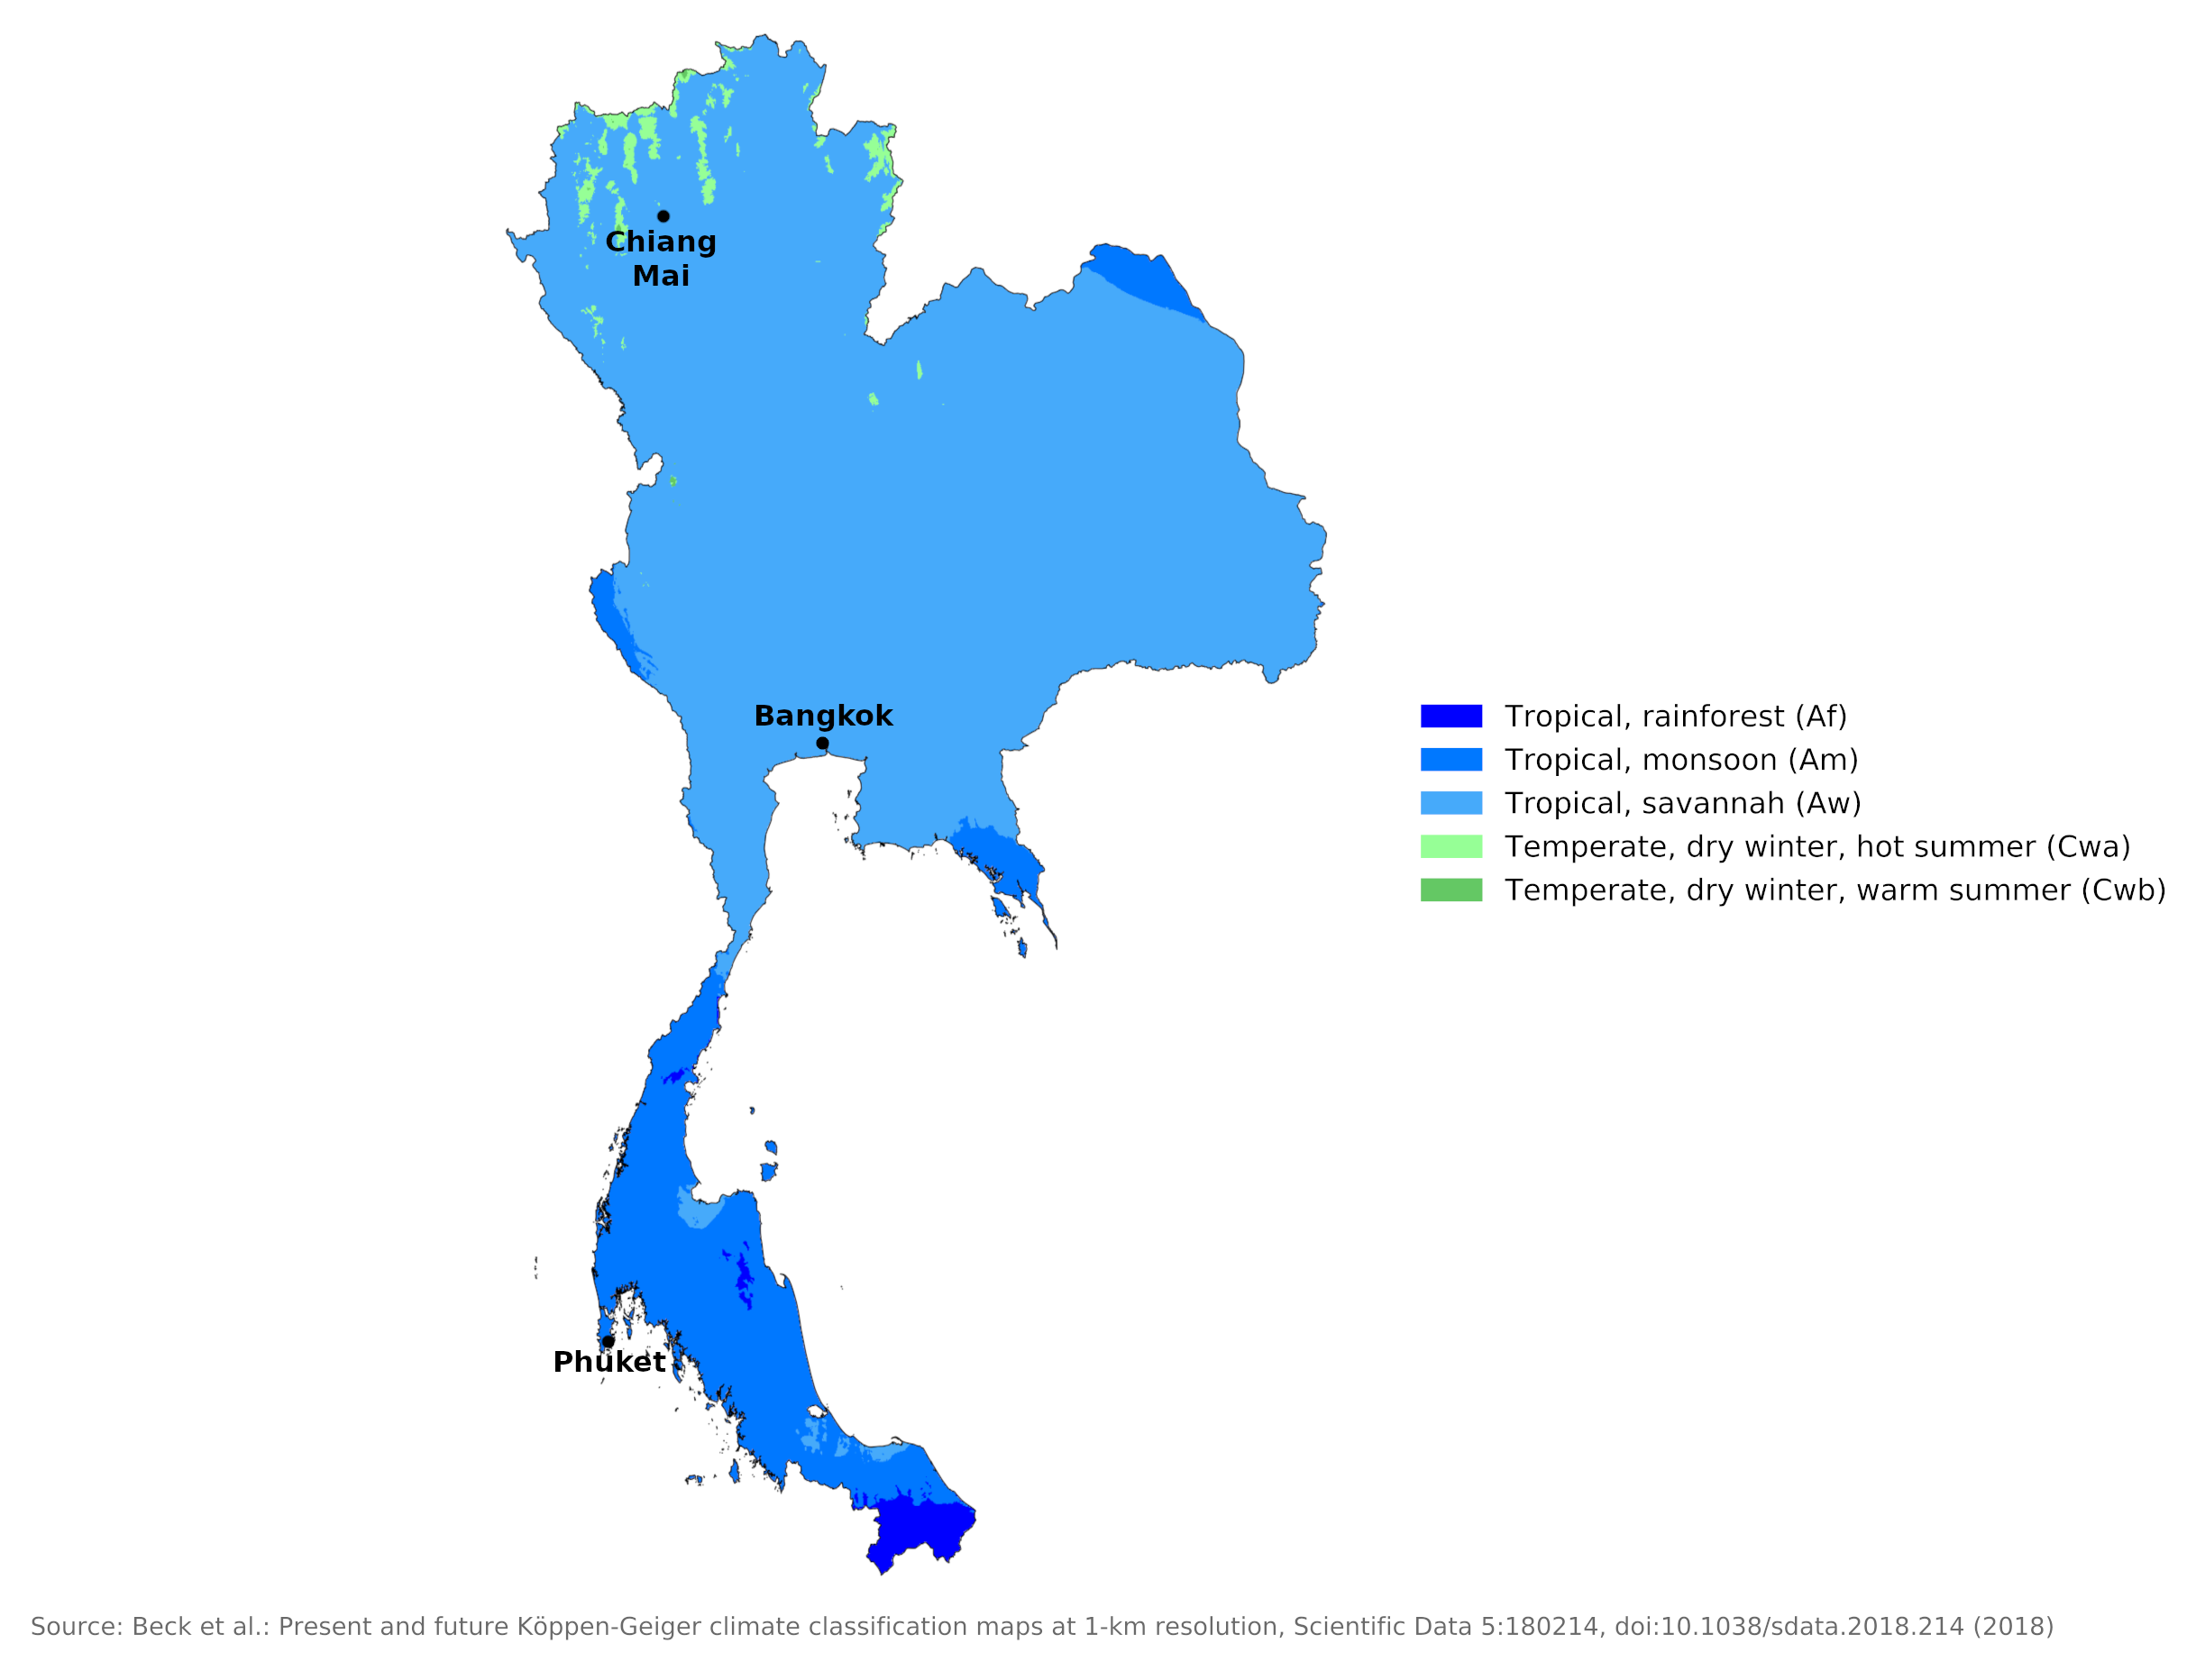 Climate map of Thailand
What is the climate of Thailand like?
Thailand in Southeast Asia is about the size of France. It is bordered by Myanmar on the north and west, by Laos and Cambodia on the east, and Malaysia on the south. It has a coastline on the Gulf of Thailand which is part of the Pacific Ocean. The south of the country is part of Peninsular Malaysia, which separates the Pacific Ocean from the Indian Ocean. Located between 6°N and 20°N, the country has an equatorial climate in the extreme south, while in the center and north there is a tropical monsoon climate similar to that of Myanmar. The north is hilly and even mountainous with land rising over 1,000 meters (3,300 feet), but most of central and eastern Thailand is low-lying with only gentle hills and slopes.
Most of Thailand has a tropical monsoon weather pattern with an equatorial climate affecting the southern peninsula. Three seasons occur each year: the rainy season from May to October, when the southwest monsoon arrives; the cool season from November to February during the northeast monsoon; and the hot season from March to May. The country's average annual temperature is 28°C (83°F), with Bangkok's average temperature varying between 25°C and 30°C (77°F to 86°F). Thailand's humidity averages 82%, dropping to 75% during the hot season.
In the middle and south of the country, there is not much variation in temperature from month to month, but in the north, the northeast monsoon season is definitely cooler. This can be seen by comparing Chiang Mai in the northern hills with Bangkok in the south of the country. In most of Thailand, the hottest months are April and May, before the cloudier, rainy weather comes with the southwest monsoon. The sunshine duration is lowest in the months June to September with an average of four to five hours a day. During the rest of the year it averages nine to ten hours.
| Climate data for Chiang Mai (1981–2010) | |||||||||||||
|---|---|---|---|---|---|---|---|---|---|---|---|---|---|
| Month | Jan | Feb | Mar | Apr | May | Jun | Jul | Aug | Sep | Oct | Nov | Dec | Year |
| Average high °C (°F) | 29.8 (85.6) | 32.7 (90.9) | 35.2 (95.4) | 36.5 (97.7) | 34.2 (93.6) | 32.7 (90.9) | 31.8 (89.2) | 31.5 (88.7) | 31.7 (89.1) | 31.4 (88.5) | 30.1 (86.2) | 28.6 (83.5) | 32.2 (90.0) |
| Daily mean °C (°F) | 21.5 (70.7) | 23.9 (75.0) | 27.1 (80.8) | 29.3 (84.7) | 28.2 (82.8) | 27.6 (81.7) | 27.2 (81.0) | 26.8 (80.2) | 26.7 (80.1) | 26.1 (79.0) | 24.0 (75.2) | 21.4 (70.5) | 25.8 (78.4) |
| Average low °C (°F) | 14.9 (58.8) | 16.2 (61.2) | 19.5 (67.1) | 22.9 (73.2) | 23.8 (74.8) | 24.0 (75.2) | 23.9 (75.0) | 23.7 (74.7) | 23.2 (73.8) | 22.2 (72.0) | 19.2 (66.6) | 15.7 (60.3) | 20.8 (69.4) |
| Average precipitation mm (inches) | 4.2 (0.17) | 8.9 (0.35) | 17.8 (0.70) | 57.3 (2.26) | 162.0 (6.38) | 124.5 (4.90) | 140.2 (5.52) | 216.9 (8.54) | 211.4 (8.32) | 117.6 (4.63) | 53.9 (2.12) | 15.9 (0.63) | 1,130.6 (44.51) |
| Source: Thai Meteorological Department | |||||||||||||
| Climate data for Bangkok (1981–2010) | |||||||||||||
|---|---|---|---|---|---|---|---|---|---|---|---|---|---|
| Month | Jan | Feb | Mar | Apr | May | Jun | Jul | Aug | Sep | Oct | Nov | Dec | Year |
| Average high °C (°F) | 32.5 (90.5) | 33.3 (91.9) | 34.3 (93.7) | 35.4 (95.7) | 34.4 (93.9) | 33.6 (92.5) | 33.2 (91.8) | 32.9 (91.2) | 32.8 (91.0) | 32.6 (90.7) | 32.4 (90.3) | 31.7 (89.1) | 33.3 (91.9) |
| Daily mean °C (°F) | 27.0 (80.6) | 28.3 (82.9) | 29.5 (85.1) | 30.5 (86.9) | 29.9 (85.8) | 29.5 (85.1) | 29.0 (84.2) | 28.8 (83.8) | 28.3 (82.9) | 28.1 (82.6) | 27.8 (82.0) | 26.5 (79.7) | 28.6 (83.5) |
| Average low °C (°F) | 22.6 (72.7) | 24.4 (75.9) | 25.9 (78.6) | 26.9 (80.4) | 26.3 (79.3) | 26.1 (79.0) | 25.7 (78.3) | 25.5 (77.9) | 25.0 (77.0) | 24.8 (76.6) | 23.9 (75.0) | 22.0 (71.6) | 24.9 (76.8) |
| Average precipitation mm (inches) | 13.3 (0.52) | 20.0 (0.79) | 42.1 (1.66) | 91.4 (3.60) | 247.7 (9.75) | 157.1 (6.19) | 175.1 (6.89) | 219.3 (8.63) | 334.3 (13.16) | 292.1 (11.50) | 49.5 (1.95) | 6.3 (0.25) | 1,648.2 (64.89) |
| Source: Thai Meteorological Department | |||||||||||||
Most parts of Thailand experience plentiful but not excessive rainfall and this is largely confined to the months of May to October. During this time of year the weather is dominated by the southwest monsoon, which blows off the Indian Ocean bringing warm, humid air and lots of clouds. The months of November to April are significantly drier, rain only falls on a few days a month. This is the time of the northeast monsoon when the wind blows overland from China or Indochina and the air is consequently much drier. In the extreme south, these winds bring more rain as they are more likely to have originated in the Pacific Ocean or blown across the Gulf of Thailand (see the climate for Phuket). Along the east coast of the Thai peninsula, the greatest amount of rain falls from September to December.
| Climate data for Phuket (1981-2010) | |||||||||||||
|---|---|---|---|---|---|---|---|---|---|---|---|---|---|
| Month | Jan | Feb | Mar | Apr | May | Jun | Jul | Aug | Sep | Oct | Nov | Dec | Year |
| Average high °C (°F) | 32.1 (89.8) | 33.1 (91.6) | 33.6 (92.5) | 33.4 (92.1) | 32.2 (90.0) | 31.7 (89.1) | 31.3 (88.3) | 31.2 (88.2) | 30.7 (87.3) | 30.8 (87.4) | 31.1 (88.0) | 31.2 (88.2) | 31.9 (89.4) |
| Daily mean °C (°F) | 27.0 (80.6) | 27.7 (81.9) | 28.3 (82.9) | 28.6 (83.5) | 28.4 (83.1) | 28.3 (82.9) | 27.9 (82.2) | 28.0 (82.4) | 27.3 (81.1) | 27.0 (80.6) | 26.9 (80.4) | 26.7 (80.1) | 27.7 (81.9) |
| Average low °C (°F) | 22.6 (72.7) | 22.8 (73.0) | 23.4 (74.1) | 24.2 (75.6) | 24.7 (76.5) | 24.9 (76.8) | 24.6 (76.3) | 24.9 (76.8) | 24.2 (75.6) | 23.8 (74.8) | 23.5 (74.3) | 22.9 (73.2) | 23.9 (75.0) |
| Average rainfall mm (inches) | 36.2 (1.43) | 27.2 (1.07) | 100.3 (3.95) | 154.0 (6.06) | 281.5 (11.08) | 256.8 (10.11) | 261.5 (10.30) | 329.8 (12.98) | 399.1 (15.71) | 353.4 (13.91) | 207.8 (8.18) | 67.4 (2.65) | 2,475 (97.43) |
| Source: Thai Meteorological Department | |||||||||||||
The average annual rainfall across Thailand is 1,400 millimeters (55 inches). Areas near the sea receive more rain than inland areas. Lying in the rain shadow of the mountains, northeast Thailand is prone to drought and water shortages. Typhoons sometimes strike in the south. Climate change also threatens Thailand with altered rainfall patterns and the possibility of major coastal flooding.
Weather in the rainy season is oppressive in most parts of Thailand due to the combination of high temperature and humidity. In the sunnier months of the dry season, conditions are fresher and there is usually more wind. Although severe heat stress is rare in Thailand, during the rainy season visitors can find the weather quite uncomfortable.
References
- E. A. Pearce, Charles Gordon Smith, (1990) The Hutchinson World Weather Guide, John Murray Press. ISBN 1859863426
- Timothy L. Gall, (ed.), (2003), Worldmark Encyclopedia of the Nations, Eleventh Edition, Thomson Gale
- Federal Research Division, Library of Congress, (1989), Thailand: a country study. Claitor's Pub. Division.
- Hugh Chisholm, (ed.), (1911), Encyclopædia Britannica, Eleventh edition, Cambridge University Press
The Climate of
Thailand
In summary:
Thailand has a tropical climate with a hot season, from March through May; the rainy or wet monsoon, June to October; and the cool season, November through February. The country’s average annual temperature is 28°C (83°F), with the average temperature in Bangkok varying from 25°C to 30°C (77°F to 86°F).
The average annual rainfall is 1400 millimeters (55 inches). Areas close to the sea receive more rain than inland areas. While Thailand receives most of its rain from June through October, the east coast of the peninsula receives most rain from September to December.