The Climate of
India
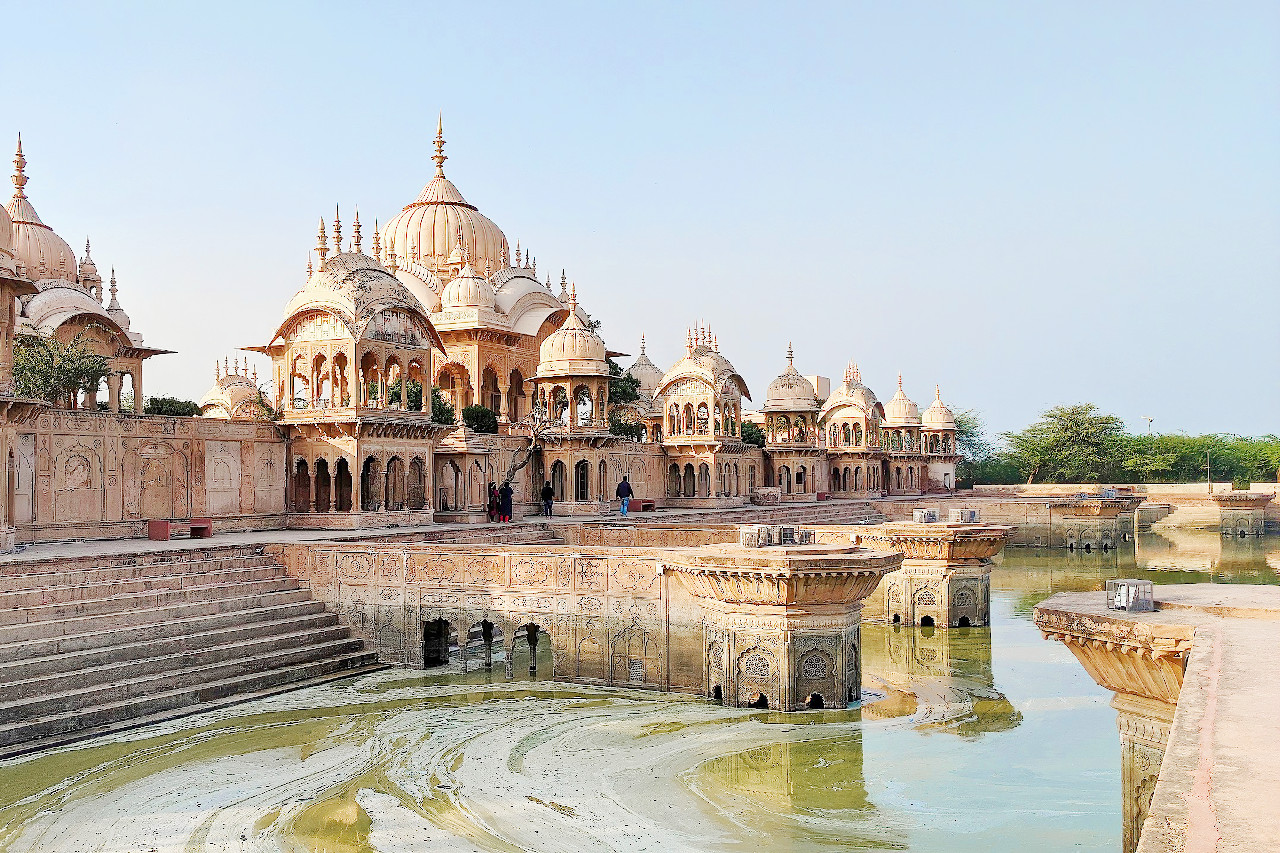 Kusum Sarovar, a historic and sacred site in Mathura district, Uttar Pradesh
Climate Map
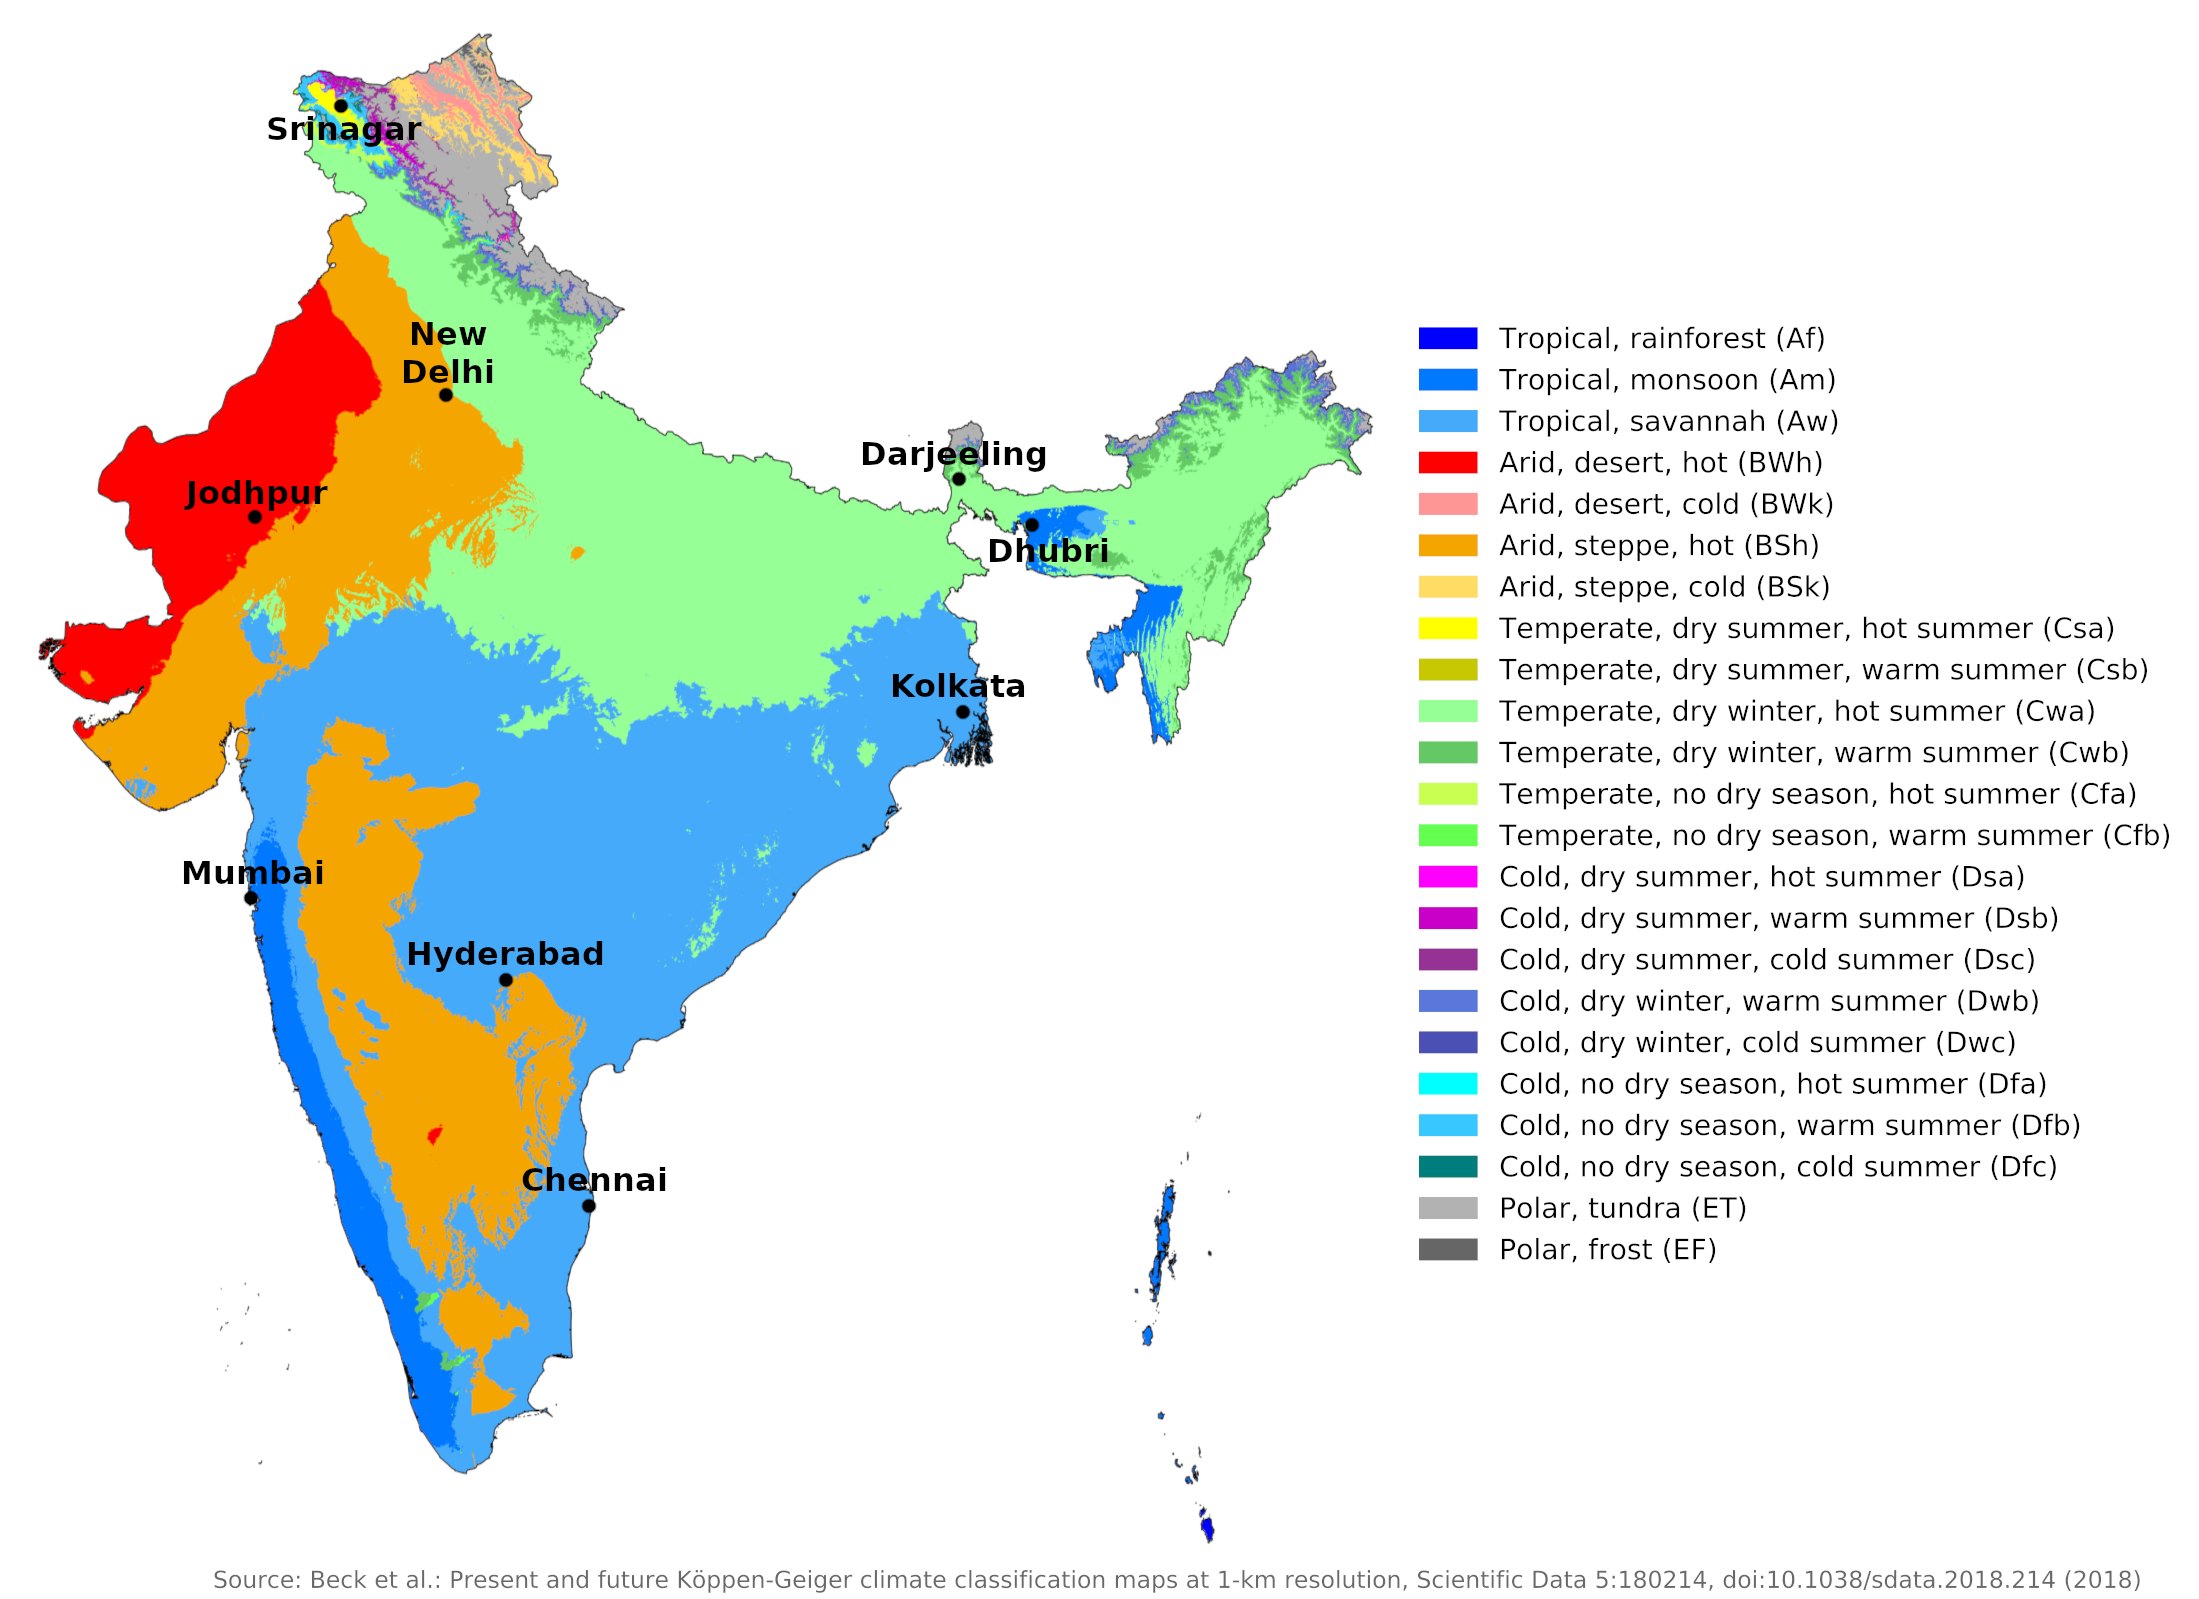 Climate map of India
What is the climate of India like?
India is a large country, almost half the size of the United States. Occupying most of the South Asian continent, it is one of the largest countries on earth and one of the most densely populated. It stretches from 8° to 33°N and includes vast plains like the Ganges valley and high mountains like the Himalayas - the highest in the world. India borders Pakistan, China, Nepal ,Bhutan, Bangladesh and Myanmar.
The great variety of terrain makes for a wide variety of climatic conditions. These range from permanent snowfields to tropical coastal areas; from areas of virtual desert in the northwestern plains to fertile, intensively cultivated paddy fields in the northeast.
The climate of India is dominated by the major wind system known as the Asian monsoon. This is completely different from the wind system prevailing in many countries in which the wind prevails from the same direction all year round. The monsoon changes direction at certain times of the year. For some months it blows steadily from the southwest; for other months from the northeast. Thus, the monsoon helps divide the year into four seasons: the relatively dry, cool winter from December through February; the dry, hot summer from March through May; the southwest monsoon from June through September when the predominating southwest maritime winds bring rains to most of the country; and the northeast, or retreating, monsoon of October and November.
From June to October, the country is influenced by the wet, rainy southwest monsoon. On some mountain ranges that face the sea, it can actually rain very heavily. The coolest and driest time in most of the country is December to February, when light northerly winds bring clear skies and little rain. From March to May, the climate gets hotter and the drought continues. The rain will only come when the wind turns southwest again.
On average, the rains—the 'burst of the monsoon' as it is called—arrive in southern India in late May or early June. It will reach the north about six weeks later. The southwest monsoon brings the moisture Indian agriculture depends on from the Indian Ocean. Unfortunately, neither the exact times of its annual arrival and departure, nor its duration and intensity can be predicted, and the variations are large.
The southwest monsoon occurs in two branches. After arriving in early June in the southern part of the peninsula, the branch known as the Arabian Sea monsoon reaches Mumbai around June 10 and has settled over most of South Asia in late June, bringing cooler but wetter weather. The other branch, known as the Bay of Bengal monsoon, moves north in the Bay of Bengal and spreads over most of Assam in the first week of June. Upon hitting the Great Himalayan Range barrier, it is deflected westward towards New Delhi along the Indo-Gangetic Plain. Thereafter, the two branches merge into a single current bringing rain to the remaining parts of North India in July.
The retreat of the monsoon is a much more gradual process than its onset. It generally withdraws from north-west India by early October and from the rest of the country by late November. During this time, the northeast winds in October contribute to the formation of the northeast monsoon over the southern half of the peninsula. It is also known as the retreating monsoon because it follows the southwest monsoon. The states of Tamil Nadu, Karnataka and Kerala receive most of their rainfall from the northeast monsoon in November and December. However, 80 percent of the country receives most of its rainfall from the southwest monsoon from June to September.
Throughout most of non-Himalayan India, the heat can be oppressive. Hot, relatively dry weather is the norm before the southwest monsoons, which, along with heavy rains and high humidity, bring cloud cover that lowers temperatures slightly. Temperatures reach 38°C (100°F) and can reach as high as 48°C (118°F) during the day in the pre-monsoon months.
India can be divided into seven climatic regions: the northern mountains or Himalayas, the northern plains from the Ganges delta to just north-west of Delhi, the Rajasthan desert, the Deccan plateau, the west coast, the south-eastern coastal areas, and Assam in the extreme northeast of the country.
The Northern Mountains
This region includes the Himalayas and its foothills. It can rain a little here all year round. In winter, light rain or snow is brought by disturbances from the west. However, the main rainy season is from July to October during the southwest monsoon. Winters are comfortable and cool at lower levels, but can get quite hot before the monsoon hits. At mid-levels, from 1,800 to 2,500 meters (6,000–8,000 feet), the summer climate is very comfortable and cool.
At about 2,000 meters (6,650 feet), the average summer temperature is near 18°C (64°F); at 4,500 meters (14,750 feet), it is rarely above 0°C (32°F). In the valleys, summer temperatures reach between 32°C and 38°C (90°F to 100°F). The eastern Himalayas receive as much as 1,000 to 2,000 millimeters (40–80 inches) more precipitation than do the Western Himalayas, and floods are common.
Sikkim has a range of climates that vary with altitude like Nepal. Kashmir (see Srinagar) and hill stations like Simla and Darjeeling are popular escapes from the heat of the plains.
| Climate data for Srinagar (1981–2010) | |||||||||||||
|---|---|---|---|---|---|---|---|---|---|---|---|---|---|
| Month | Jan | Feb | Mar | Apr | May | Jun | Jul | Aug | Sep | Oct | Nov | Dec | Year |
| Average high °C (°F) | 6.7 (44.1) | 9.8 (49.6) | 14.9 (58.8) | 20.4 (68.7) | 24.4 (75.9) | 28.6 (83.5) | 29.7 (85.5) | 29.5 (85.1) | 27.6 (81.7) | 22.5 (72.5) | 16.0 (60.8) | 9.5 (49.1) | 20.0 (68.0) |
| Daily mean °C (°F) | 3.0 (37.4) | 5.1 (41.2) | 9.5 (49.1) | 14.1 (57.4) | 17.8 (64.0) | 21.6 (70.9) | 23.9 (75.0) | 23.5 (74.3) | 20.1 (68.2) | 14.1 (57.4) | 8.2 (46.8) | 4.0 (39.2) | 13.7 (56.7) |
| Average low °C (°F) | −1.9 (28.6) | 0.4 (32.7) | 4.1 (39.4) | 7.8 (46.0) | 11.0 (51.8) | 14.8 (58.6) | 18.2 (64.8) | 17.7 (63.9) | 12.6 (54.7) | 5.9 (42.6) | 1.0 (33.8) | −1.4 (29.5) | 7.5 (45.5) |
| Average precipitation mm (inches) | 53.9 (2.12) | 81.9 (3.22) | 117.6 (4.63) | 90.8 (3.57) | 71.0 (2.80) | 42.0 (1.65) | 68.9 (2.71) | 64.2 (2.53) | 29.0 (1.14) | 27.8 (1.09) | 28.7 (1.13) | 46.0 (1.81) | 721.8 (28.42) |
| Source: India Meteorological Department | |||||||||||||
| Climate data for Darjeeling (1981–2010) | |||||||||||||
|---|---|---|---|---|---|---|---|---|---|---|---|---|---|
| Month | Jan | Feb | Mar | Apr | May | Jun | Jul | Aug | Sep | Oct | Nov | Dec | Year |
| Average high °C (°F) | 10.7 (51.3) | 12.4 (54.3) | 15.6 (60.1) | 18.5 (65.3) | 19.3 (66.7) | 19.8 (67.6) | 19.6 (67.3) | 20.0 (68.0) | 19.8 (67.6) | 19.5 (67.1) | 17.1 (62.8) | 14.0 (57.2) | 17.2 (63.0) |
| Daily mean °C (°F) | 6.1 (43.0) | 7.7 (45.9) | 10.6 (51.1) | 13.7 (56.7) | 14.9 (58.8) | 16.3 (61.3) | 16.5 (61.7) | 16.7 (62.1) | 16.1 (61.0) | 15.0 (59.0) | 11.7 (53.1) | 8.9 (48.0) | 12.9 (55.1) |
| Average low °C (°F) | 1.5 (34.7) | 2.9 (37.2) | 5.7 (42.3) | 8.8 (47.8) | 10.6 (51.1) | 12.8 (55.0) | 13.4 (56.1) | 13.4 (56.1) | 12.4 (54.3) | 10.5 (50.9) | 6.3 (43.3) | 3.8 (38.8) | 8.5 (47.3) |
| Average precipitation mm (inches) | 13.5 (0.53) | 14.0 (0.55) | 30.8 (1.21) | 76.9 (3.03) | 137.9 (5.43) | 466.0 (18.35) | 656.7 (25.85) | 528.2 (20.80) | 379.7 (14.95) | 59.1 (2.33) | 14.4 (0.57) | 2.9 (0.11) | 2,380 (93.70) |
| Source: India Meteorological Department | |||||||||||||
The Northern Plains
This low-lying region stretches from the Punjab to the Ganges Delta and is hot throughout and generally dry from March to June. Thunderstorms occasionally occur at this time of year, particularly in the east. With the arrival of the main monsoon rains in July, temperatures drop somewhat in overcast weather, but the high humidity means this time of year is almost as uncomfortable as the previous hot season, and nights are particularly muggy.
Rainfall decreases from east to west and conditions border on desert in the west and northwest of Delhi. During the winter season from December to February the weather is generally sunny and dry. The nights and early mornings can feel quite chilly, but the days are warm and comfortable. Light rain is possible in the west and no part of the region is completely dry at this time. The contrast between the wetter east and the drier west is well-illustrated when comparing Kolkata and Delhi.
| Climate data for Kolkata (1981–2010) | |||||||||||||
|---|---|---|---|---|---|---|---|---|---|---|---|---|---|
| Month | Jan | Feb | Mar | Apr | May | Jun | Jul | Aug | Sep | Oct | Nov | Dec | Year |
| Average high °C (°F) | 25.8 (78.4) | 29.2 (84.6) | 33.5 (92.3) | 35.3 (95.5) | 35.3 (95.5) | 33.8 (92.8) | 32.4 (90.3) | 32.2 (90.0) | 32.4 (90.3) | 32.2 (90.0) | 30.1 (86.2) | 27.0 (80.6) | 31.6 (88.9) |
| Daily mean °C (°F) | 20.0 (68.0) | 23.6 (74.5) | 28.0 (82.4) | 30.4 (86.7) | 30.9 (87.6) | 30.4 (86.7) | 29.4 (84.9) | 29.3 (84.7) | 29.2 (84.6) | 28.1 (82.6) | 25.0 (77.0) | 21.2 (70.2) | 27.1 (80.8) |
| Average low °C (°F) | 14.1 (57.4) | 17.8 (64.0) | 22.4 (72.3) | 25.3 (77.5) | 26.4 (79.5) | 26.8 (80.2) | 26.5 (79.7) | 26.4 (79.5) | 26.0 (78.8) | 24.1 (75.4) | 19.7 (67.5) | 15.2 (59.4) | 22.6 (72.7) |
| Average precipitation mm (inches) | 10.4 (0.41) | 20.9 (0.82) | 35.2 (1.39) | 58.9 (2.32) | 133.1 (5.24) | 300.6 (11.83) | 396.0 (15.59) | 344.5 (13.56) | 318.1 (12.52) | 180.5 (7.11) | 35.1 (1.38) | 3.2 (0.13) | 1,836.5 (72.30) |
| Source: India Meteorological Department | |||||||||||||
| Climate data for New Delhi (1991–2020) | |||||||||||||
|---|---|---|---|---|---|---|---|---|---|---|---|---|---|
| Month | Jan | Feb | Mar | Apr | May | Jun | Jul | Aug | Sep | Oct | Nov | Dec | Year |
| Average high °C (°F) | 20.1 (68.2) | 24.2 (75.6) | 29.9 (85.8) | 36.5 (97.7) | 39.9 (103.8) | 39.0 (102.2) | 35.6 (96.1) | 34.2 (93.6) | 34.1 (93.4) | 33.0 (91.4) | 28.4 (83.1) | 22.8 (73.0) | 31.4 (88.5) |
| Daily mean °C (°F) | 14.1 (57.4) | 17.4 (63.3) | 22.7 (72.9) | 28.9 (84.0) | 32.7 (90.9) | 33.2 (91.8) | 31.4 (88.5) | 30.3 (86.5) | 29.6 (85.3) | 26.0 (78.8) | 20.5 (68.9) | 15.5 (59.9) | 25.2 (77.4) |
| Average low °C (°F) | 7.5 (45.5) | 10.6 (51.1) | 15.6 (60.1) | 21.3 (70.3) | 25.8 (78.4) | 27.7 (81.9) | 27.5 (81.5) | 26.7 (80.1) | 25.0 (77.0) | 19.5 (67.1) | 13.0 (55.4) | 8.4 (47.1) | 18.9 (66.0) |
| Average precipitation mm (inches) | 19.2 (0.76) | 21.5 (0.85) | 19.1 (0.75) | 12.5 (0.49) | 29.4 (1.16) | 80.6 (3.17) | 195.8 (7.71) | 226.8 (8.93) | 128.0 (5.04) | 14.1 (0.56) | 4.1 (0.16) | 8.0 (0.31) | 759.1 (29.89) |
| Source: India Meteorological Department | |||||||||||||
The Rajasthan Desert
This is the eastern part of the Thar or Great Indian Desert. The climate here is similar to that of Sind Province in Pakistan to the west and Jodhpur provides a good illustration of year-round conditions. The annual precipitation is almost everywhere under 500 millimeters (20 inches) per year and in many places only half. This area is one of the hottest parts of the world from May to July and the arrival of the monsoon with light rain and more cloud changes the temperatures little, leaving July, August and September uncomfortably hot and humid. The cool season from November to March is warm, sunny and dry.
| Climate data for Jodhpur (1971–2000) | |||||||||||||
|---|---|---|---|---|---|---|---|---|---|---|---|---|---|
| Month | Jan | Feb | Mar | Apr | May | Jun | Jul | Aug | Sep | Oct | Nov | Dec | Year |
| Average high °C (°F) | 24.5 (76.1) | 27.4 (81.3) | 33.4 (92.1) | 38.4 (101.1) | 41.2 (106.2) | 40.0 (104.0) | 35.2 (95.4) | 33.5 (92.3) | 34.9 (94.8) | 35.8 (96.4) | 31.2 (88.2) | 26.9 (80.4) | 33.5 (92.3) |
| Daily mean °C (°F) | 17.1 (62.8) | 19.6 (67.3) | 25.4 (77.7) | 30.5 (86.9) | 33.9 (93.0) | 33.9 (93.0) | 30.8 (87.4) | 29.5 (85.1) | 29.4 (84.9) | 28.0 (82.4) | 23.0 (73.4) | 19.1 (66.4) | 26.7 (80.1) |
| Average low °C (°F) | 9.6 (49.3) | 11.7 (53.1) | 17.3 (63.1) | 22.6 (72.7) | 26.5 (79.7) | 27.8 (82.0) | 26.4 (79.5) | 25.4 (77.7) | 23.9 (75.0) | 20.1 (68.2) | 14.7 (58.5) | 11.2 (52.2) | 19.8 (67.6) |
| Average precipitation mm (inches) | 4.0 (0.16) | 4.0 (0.16) | 1.3 (0.05) | 4.8 (0.19) | 17.4 (0.69) | 40.0 (1.57) | 120.5 (4.74) | 111.8 (4.40) | 49.9 (1.96) | 6.9 (0.27) | 1.9 (0.07) | 0.5 (0.02) | 362.9 (14.29) |
| Source: India Meteorological Department | |||||||||||||
The Deccan Plateau
The interior of the center and the south is a low plateau with a different climate than that of the coastal areas. The three main seasonal divisions of the year apply equally here, but rainfall is generally moderate compared to coastal areas and rather light in the North West. The northern Deccan region receives most of its annual rainfall during the summer monsoon season. The southern Deccan area is in a "rain shadow" and receives under 1,000 millimeters (40 inches) of rainfall a year.
Temperature ranges are wide: from some 15°C to 39°C (59°F to 103°F) During the hot season, temperatures can approach those of the northern plains. Elevation is the main control point for temperature, but heading south even the cool season is typically tropical, when warm sunny days are tempered by dry heat and comfortable cool evenings. Hyderabad is representative of this region.
| Climate data for Hyderabad (1981–2010) | |||||||||||||
|---|---|---|---|---|---|---|---|---|---|---|---|---|---|
| Month | Jan | Feb | Mar | Apr | May | Jun | Jul | Aug | Sep | Oct | Nov | Dec | Year |
| Average high °C (°F) | 29.3 (84.7) | 32.4 (90.3) | 35.9 (96.6) | 38.1 (100.6) | 39.4 (102.9) | 34.9 (94.8) | 31.3 (88.3) | 30.1 (86.2) | 31.1 (88.0) | 31.0 (87.8) | 29.6 (85.3) | 28.7 (83.7) | 32.7 (90.9) |
| Daily mean °C (°F) | 22.7 (72.9) | 25.3 (77.5) | 28.6 (83.5) | 31.3 (88.3) | 33.0 (91.4) | 29.7 (85.5) | 27.0 (80.6) | 26.2 (79.2) | 26.7 (80.1) | 25.8 (78.4) | 23.7 (74.7) | 21.9 (71.4) | 26.8 (80.2) |
| Average low °C (°F) | 15.9 (60.6) | 18.3 (64.9) | 21.5 (70.7) | 24.4 (75.9) | 26.3 (79.3) | 24.2 (75.6) | 22.8 (73.0) | 22.2 (72.0) | 22.3 (72.1) | 20.6 (69.1) | 17.4 (63.3) | 15.1 (59.2) | 20.9 (69.6) |
| Average precipitation mm (inches) | 9.3 (0.37) | 9.2 (0.36) | 17.8 (0.70) | 21.7 (0.85) | 31.7 (1.25) | 111.2 (4.38) | 179.2 (7.06) | 207.0 (8.15) | 132.9 (5.23) | 103.6 (4.08) | 26.1 (1.03) | 4.9 (0.19) | 854.6 (33.65) |
| Source: India Meteorological Department | |||||||||||||
The West Coast
This consists of a narrow coastal plain backed by a steep mountain barrier, the Western Ghats. These mountains and the adjoining coast receive heavy rains during the southwest monsoon. The heat can be very oppressive all year round due to the humidity, especially in the hot season. Some hill stations in the Western Ghats have a comfortable climate during the hot season but are very cloudy and wet during the monsoon. Heading south, there can be some rain at any time of the year and the monsoons come earlier. Mumbai is representative of sea level conditions.
| Climate data for Mumbai (1991–2020) | |||||||||||||
|---|---|---|---|---|---|---|---|---|---|---|---|---|---|
| Month | Jan | Feb | Mar | Apr | May | Jun | Jul | Aug | Sep | Oct | Nov | Dec | Year |
| Average high °C (°F) | 30.2 (86.4) | 30.3 (86.5) | 31.7 (89.1) | 32.9 (91.2) | 34.0 (93.2) | 32.2 (90.0) | 29.9 (85.8) | 29.9 (85.8) | 30.6 (87.1) | 33.1 (91.6) | 33.8 (92.8) | 32.2 (90.0) | 31.7 (89.1) |
| Daily mean °C (°F) | 24.9 (76.8) | 25.3 (77.5) | 27.1 (80.8) | 28.9 (84.0) | 30.5 (86.9) | 29.3 (84.7) | 27.8 (82.0) | 27.4 (81.3) | 27.8 (82.0) | 28.9 (84.0) | 28.4 (83.1) | 26.5 (79.7) | 27.7 (81.9) |
| Average low °C (°F) | 19.4 (66.9) | 20.4 (68.7) | 23.0 (73.4) | 25.3 (77.5) | 27.3 (81.1) | 26.6 (79.9) | 25.5 (77.9) | 25.2 (77.4) | 25.1 (77.2) | 25.1 (77.2) | 23.6 (74.5) | 21.2 (70.2) | 24 (75) |
| Average precipitation mm (inches) | 0.6 (0.02) | 0.4 (0.02) | 0.7 (0.03) | 0.2 (0.01) | 15.9 (0.63) | 506.0 (19.92) | 768.5 (30.26) | 471.9 (18.58) | 355.6 (14.00) | 81.7 (3.22) | 8.5 (0.33) | 3.4 (0.13) | 2,213.4 (87.14) |
| Source: India Meteorological Department | |||||||||||||
The Southeastern Coastlands
Here the main rains do not occur until the October to December period and are often associated with tropical storms or cyclones developing in the Bay of Bengal. Due to the lack of clouds, the southwest monsoon period from June to September can be very uncomfortable as the temperature and humidity are high.
The east coast north of Banda has its main rainy season around the time of the southwest monsoon, but this area is occasionally hit by very heavy rains and strong winds caused by tropical cyclones from July to November. Chennai is representative of this region.
| Climate data for Chennai (1981–2010) | |||||||||||||
|---|---|---|---|---|---|---|---|---|---|---|---|---|---|
| Month | Jan | Feb | Mar | Apr | May | Jun | Jul | Aug | Sep | Oct | Nov | Dec | Year |
| Average high °C (°F) | 29.3 (84.7) | 30.9 (87.6) | 32.9 (91.2) | 34.5 (94.1) | 37.1 (98.8) | 37.0 (98.6) | 35.3 (95.5) | 34.7 (94.5) | 34.2 (93.6) | 32.1 (89.8) | 29.9 (85.8) | 28.9 (84.0) | 33.1 (91.6) |
| Daily mean °C (°F) | 25.2 (77.4) | 26.6 (79.9) | 28.7 (83.7) | 30.9 (87.6) | 32.9 (91.2) | 32.4 (90.3) | 30.9 (87.6) | 30.3 (86.5) | 29.8 (85.6) | 28.4 (83.1) | 26.5 (79.7) | 25.3 (77.5) | 29.0 (84.2) |
| Average low °C (°F) | 21.2 (70.2) | 22.2 (72.0) | 24.2 (75.6) | 26.6 (79.9) | 28.0 (82.4) | 27.5 (81.5) | 26.4 (79.5) | 25.9 (78.6) | 25.6 (78.1) | 24.6 (76.3) | 23.1 (73.6) | 21.9 (71.4) | 24.8 (76.6) |
| Average precipitation mm (inches) | 25.9 (1.02) | 3.4 (0.13) | 3.5 (0.14) | 14.4 (0.57) | 34.2 (1.35) | 55.8 (2.20) | 103.8 (4.09) | 126.8 (4.99) | 147.7 (5.81) | 315.6 (12.43) | 399.9 (15.74) | 177.4 (6.98) | 1,382.9 (54.44) |
| Source: India Meteorological Department | |||||||||||||
Assam
This area is almost separated from the rest of India by Bangladesh. It is a region of plains and mountain ranges. Depending on the altitude, the climate is similar to that of the northern plains and the Himalayas. Rainfall can be significant here in the period from March to May, but the main rainy season from June to October is very wet in places, and Cherrapunji at an altitude of 1,300 meters (4,300 ft) has the particularity of being one of the three wettest places in the world with an average annual rainfall of 10,800 millimeters (425 inches). Dhubri is representative of the lowlands.
| Climate data for Dhubri (1981–2000) | |||||||||||||
|---|---|---|---|---|---|---|---|---|---|---|---|---|---|
| Month | Jan | Feb | Mar | Apr | May | Jun | Jul | Aug | Sep | Oct | Nov | Dec | Year |
| Average high °C (°F) | 23.6 (74.5) | 26.0 (78.8) | 30.1 (86.2) | 31.2 (88.2) | 30.7 (87.3) | 31.6 (88.9) | 31.1 (88.0) | 31.9 (89.4) | 30.6 (87.1) | 30.2 (86.4) | 27.7 (81.9) | 24.4 (75.9) | 29.1 (84.4) |
| Daily mean °C (°F) | 16.5 (61.7) | 18.5 (65.3) | 22.9 (73.2) | 25.6 (78.1) | 26.5 (79.7) | 28.1 (82.6) | 28.2 (82.8) | 28.7 (83.7) | 27.5 (81.5) | 25.7 (78.3) | 21.5 (70.7) | 17.8 (64.0) | 23.9 (75.0) |
| Average low °C (°F) | 9.3 (48.7) | 10.9 (51.6) | 15.7 (60.3) | 19.9 (67.8) | 22.3 (72.1) | 24.5 (76.1) | 25.2 (77.4) | 25.4 (77.7) | 24.3 (75.7) | 21.1 (70.0) | 15.3 (59.5) | 11.1 (52.0) | 18.7 (65.7) |
| Average precipitation mm (inches) | 6.8 (0.27) | 24.8 (0.98) | 42.3 (1.67) | 179.4 (7.06) | 437.3 (17.22) | 577.2 (22.72) | 662.5 (26.08) | 436.1 (17.17) | 426.8 (16.80) | 131.5 (5.18) | 7.1 (0.28) | 7.3 (0.29) | 2,939.1 (115.71) |
| Source: India Meteorological Department | |||||||||||||
References
- E. A. Pearce, Charles Gordon Smith, (1990) The Hutchinson World Weather Guide, John Murray Press. ISBN 1859863426
- Timothy L. Gall, (ed.), (2003), Worldmark Encyclopedia of the Nations, Eleventh Edition, Thomson Gale
- Federal Research Division, Library of Congress, (1996), India: a country study. Claitor's Pub. Division. ISBN 0844408336
- Hugh Chisholm, (ed.), (1911), Encyclopædia Britannica, Eleventh edition, Cambridge University Press
The Climate of
India
In summary:
India experiences a variety of different climate conditions due to its great size and varying terrain. The lower east and west coasts of the Peninsula and the Ganges Delta are humid tropical; most of the Peninsula and the Ganges-Brahmaputra Lowland are moist subtropical to temperate; and the semiarid steppe and dry desert of the far west are subtropical to temperate. The Himalayan mountains change from moist subtropical to dry arctic.
The monsoon is the predominant feature of India’s climate and helps to divide the year into four seasons: rainy, the southwest monsoon, June–September; moist, the retreating monsoon, October–November; dry cool, the northeast monsoon, December–March; hot, April–May. The southwest monsoon brings from the Indian Ocean the moisture on which Indian agriculture relies.